FEAR & GREED INDEX 18
Weekly Update
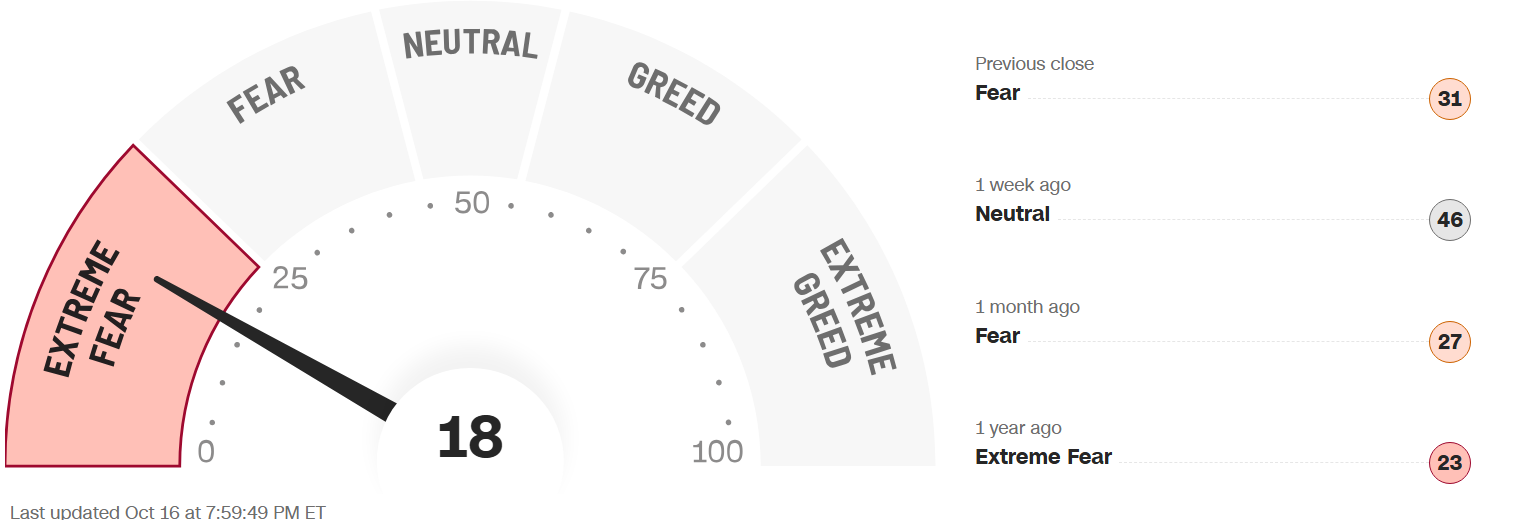
The Fear & Greed Index (found on cnn.com) is one of the easiest indicators to use to determine current market emotion. This simple to read gauge, highlighted in our publication When to Buy and When to Sell: Combining Easy Indicators, Charts, and Financial Astrology (available on Amazon), is measured in a range from 0-100, and currently reads 18 as of the close on Friday, October 16, 2026.
The gauge plunged into the Extreme Fear category this week, falling 27 points from last week’s close of 45. This was reflected in the S&P 500, which dropped 151 points, from 7,811 to 7,660, as inflation worries hit hard the 2nd half of the week. Remember, this level of fear often suggests a rally in the near future, and the lower it falls, the more likely it is to happen.
The 7 internal factors used to formulate this gauge are listed on the screen (below):
Market Momentum – (S&P 500 vs its 125-day moving avg) = EXTREME FEAR
Stock Price Strength (# of new 52-week highs vs new 52-week lows) = EXTREME FEAR
Stock Price Breadth (# of shares rising vs falling on NYSE) = EXTREME FEAR
Market Volatility (measured by the VIX) = EXTREME FEAR
Put to Call Ratio 5-day avg. (# of Puts (bearish) vs Calls (bullish) = EXTREME FEAR
Safe-Haven Demand (which measures stocks vs bonds) = EXTREME FEAR
Junk Bond Demand (non-govt. bond yield spread) = FEAR
This week, 4 of these 7 factors changed levels, as overall momentum plunged into Extreme Fear for basically all categories across the board. For weeks we had expressed the fragile underlying structure of the markets in this seasonally weak period, an indicator of defensive positioning by institutions.
Market internals momentum Moving Averages’ (MAs) bearish sentiment continued, with the longer-term 200-days in an official “bear” market (under 50%), now at 41% (vs last week’s close of 43%), with the DJIA still leading at 67%, (vs 60% as week). The shorter-term MAs remained at 28% on the 50-day (vs 28% last week), and bumped up to 40% on the 20-day (vs 38% last week), as the slump was focused more heavily on chips and technology. Sector strength also remained very fragmented once again this week, as speculative stocks reversed downward, led by Chips/Infotech. Defensive sectors including Healthcare, Energy, and Utilities remained strong in the short-term. The beginning of earnings season has reported mixed results in the important Financials sector as well.
The “Risk-On” sentiment collapsed late week, as uncertainty regarding the military conflict, rising oil prices, and high inflation-related readings continue to control the market. 10-yr bond yields remain elevated, as they have for several weeks, though they ended the week lower by 0.16 points, at 5.08%, from last week’s close of 5.24%. Bond yields have remained well over the 5% mark for several weeks now, for the first time since October of 2023, and only the second time since 2007, just prior to the Global Financial Crisis. The Mannarino Risk Index decreased 12 points to 321, vs last week’s 333, but remains firmly in the mid-Extreme Risk level (max is 350), as it has closed over 300 for the 5th straight week.
The VIX (market volatility), spiked over the past few days, rising 5.7 points (38%), to 20.5 vs last weeks close of 14.8, a move that has been expected for weeks. As we often note, any break-through of the crucial “20” mark suggests a pullback.
Economic reports this week focused largely on the CPI and PPI inflation reports. Unfortunately, both reflected higher numbers Year-over-Year, which again spooked the markets as the expectations for another rate hike rose.
Astrologically, we near the end of Libra season on Friday, October 22. As noted, Libra signifies balance, fairness, and justice, which has recently emerged in the Equal-weight S&P (RSP), as broader strength has occurred. Major uncertainty and nervousness persist in market conditions, which caused the expected spike in volatility. Scorpio season now looms (Oct 23 – Nov 21), signifying sharper, Mars led aggressive energies. Please review our Sign Language – Scorpio blog, dated 10-8-26 for more details.
As discussed in recent weeks, current shorter-term transits/aspects of note include the ongoing Venus Retrograde (Oct 3 – Nov 14), which finally kicked in this week, and the upcoming Mercury Retrograde (Oct 24 – Nov 15), which are both traditionally negative for the markets. Both retrogrades will last through the Mid-Term Elections, another historical volatile time frame, during which tighter stop-losses and lower share sizes are suggested. Please review our Did You Know – About the Mid-Term Elections blog, dated 9-23-26, for more details.
Longer-term, the planet Jupiter remains in the sign of Leo until July 26, 2027, highlighting fashion, self-pleasing products, creativity, and travel (signified by the Consumer Discretionary sector), as well as leadership, defense, and gold (Please refer to our Trader Transits – Jupiter in Leo blog, dated 6-12-26, for further information). Consumer Discretionary stocks, that usually rally in the holiday shopping period, have stalled with recent low Consumer Sentiment and Confidence readings, as well as rising interest rates. Keep in mind that travel-related stocks have slumped due to their sensitivity to oil prices, which are vulnerable to the military conflict status (or “perceived” status).
Also, as discussed heavily in recent months, Uranus (sudden, unexpected events/high technology) will remain in the sign of Gemini (communications, transportation, advanced technology) until 2033. Uranus’ energies have continued since the end of May, when Uranus entered the sign, with unexpected reversals in both directions (especially with technology), as the market remains choppy and cannot seem to make up its mind (Gemini). Please also review our Trader Transits – Uranus in Gemini blog, dated 3-30-26.
As we have noted for over 1 year now, sectors of the technology industry that are likely to continue their advance into the future include AI, robotics, quantum computing, and space development, with both Pluto positioned in Aquarius, and Uranus in Gemini, for many years to come, though they will experience pullbacks (sometimes sizeable) along the way.
Gold (ruled by the Sun), and Silver (ruled by the Moon), continued to slump for the first half of the week, before surging on Thursday, after the inflation reports. The Gold to Silver Ratio has risen to 73, increasing 4.1 points from last week’s close of 68.9, its highest reading in 10 months. The level remains neutral, though would be favoring silver if it continues to rise. As we continue to stress, both metals remain good buys after pullbacks, so long as central banks continue to buy, which they are, and Safe-Haven investments remain popular, which is expected. However, there may be a further pullback if the additional rate hike occurs.
Finally, Bitcoin (ruled by Uranus), continued its slow decline this week as volume remains low. Its Fear & Greed Index remains in the Neutral level, but ended the week 6 points lower, at 49, after closing last week at 55. There is no current catalyst for crypto as the recently discussed Clarity Act has stalled in the Senate, and still awaits the next step. Please review our Did You Know? – About The Clarity Act blog, dated 7-26-26, for further information.
***As always, this information is not intended to be financial advice, or any specific buy or sell recommendation, but rather a guide to assist the reader in some further understanding of current economic conditions/movements in the sky, and how they can affect moods, behaviors, world events, and financial markets.