FEAR & GREED INDEX 20
Weekly Update
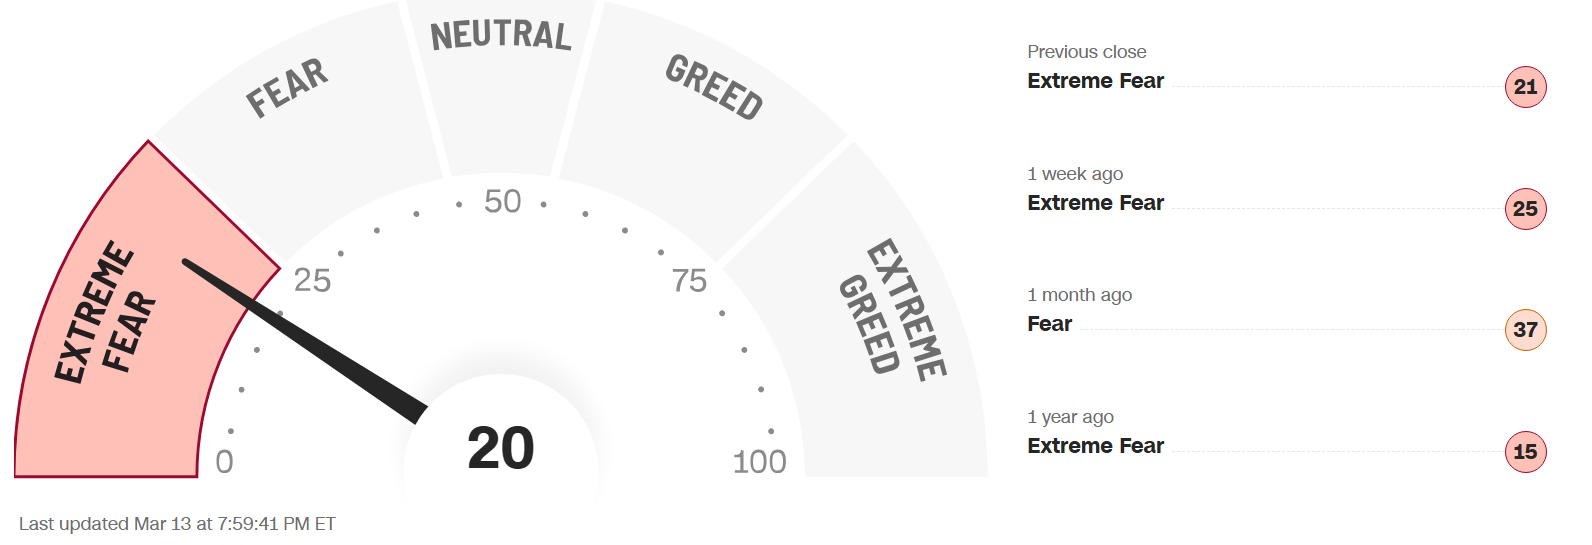
The Fear & Greed Index (found on cnn.com) is one of the easiest indicators to use to determine current market emotion. This simple to read gauge, highlighted in our publication When to Buy and When to Sell: Combining Easy Indicators, Charts, and Financial Astrology (available on Amazon), is measured in a range from 0-100, and currently reads 20 as of the close on Friday, March 13, 2026.
This figure dropped to the Extreme Fear level, after falling 7 points from last week’s close of 27. This was reflected in the S&P 500, which declined about 108 points, from 6,740 to 6,632, finally succumbing to economic pressure and rising oil. Keep in mind, however, that the further this gauge drops, the more likely a bounce in equities becomes.
The 4 major indexes’ 200-day MA (Moving Average) have basically ceded their internal bullish sentiment, as they have all dipped below the 50% range, signifying a Bear market. The shorter-term 20 and 50-day MAs have plunged, dragging the 200’s with them.
The “Risk-Off” sentiment heightened this week, as geopolitical conflict, quickly rising mortgage rates, and no improvement in inflation figures weighed on the markets. 10-year bond yields continue to rise, ending the week at 4.28%, vs last week’s close of 4.14%, confirming that the “risk-off” is not a result of a Flight-to-Quality move (selling stocks to buy bonds).
The 7 internal factors used to formulate this gauge are listed on the screen (below):
Market Momentum – (S&P 500 vs its 125-day moving avg) = EXTREME FEAR
Market Volatility (measured by the VIX) = FEAR
Put to Call Ratio 5-day avg. (# of Puts (bearish) vs Calls (bullish) = EXTREMEFEAR
Stock Price Strength (# of new 52-week highs vs new 52-week lows) = FEAR
Stock Price Breadth (# of shares rising vs falling on NYSE) = EXTREME FEAR
Safe-Haven Demand (which measures stocks vs bonds) = EXTREME FEAR
Junk Bond Demand (non-govt. bond yieldspread) = EXTREME FEAR
This week 3 of these 7 factors changed levels, as both Stock Price Strength and Breadth finally joined the rest in Fear categories. As recently discussed, the seasonal volatility has returned, combined with the global conflict uncertainty, that is keeping risk aversion at heightened levels. It should also be noted that the Put to Call Ratio remained at the Extreme Fear level, suggesting that put buying may overdone, indicating a potential improvement in equities in the near future.
The VIX, measured by Market Volatility, dropped slightly by week’s end, closing at 27.2,compared to last week’s close of 29.5, though it did spike over 31 at Mondays open. The gauge has now remained above the crucial “20” level for 10 straight trading days. As we warned over the past several weeks, March is normally very wishy-washy, but tends to improve over the 2nd half of the month.
News this week mainly focused on the geopolitical conflict in the Middle East, and the CPI inflation gauge, which was unchanged Year-over-Year. Though oil prices decreased from the huge spike over last weekend, they crept up again late in the week. As the uncertainty remains, and the VIX remains over 20, markets are likely to continue their struggle.
As we also discussed the past few weeks, we have now officially entered the 2nd year of the Presidential Cycle, known as the Mid-Term Year, which has historically posted the worst returns of the 4-year cycle, at least leading up to the elections. Please see our Did You Know – About the Mid-Term Election Year blog, dated 12-27-25, for more details.
Astrologically, we continue through Pisces season, the 12th sign of the zodiac, ruled by Jupiter (Feb 19 – Mar 20). Please see our recent Sign Language – Pisces blog, dated 2-6-26 for full details. Pisces season has already provided massive volatility, as the combined energies of Jupiter (expansive) and co-ruler Neptune (imaginative, secretive), have continued the uncertainty theme in the equities markets. With a very active sky, including an emotional (Full Moon) Lunar Eclipse on Tuesday the 3rd, Mercury Retrograde (Feb 26 – Mar 20), Venus’ conjunction of Neptune (Mar 7), and Saturn (Mar 8), Jupiter turning direct (10th-11th), Mars conjunct the North Node (on Friday the 13th!), and Mars conjunct Mercury today (15th). There is still more to come, as March 20, the last day of Pisces season, will be met with Mercury turning direct, quad-witching options expiration day on the S&P and Nasdaq (occurs 4 times per year), and both the Sun and Moon entering Aries together. (Please review our Sign Language – Aries Season blog, dated 3-6-26).
The planet Mercury remains in the sign of Pisces (Feb 6 – Apr 14), and began its current retrograde period on Thursday (Feb 26). Miscommunication, false reports, and uncertainty on a global basis are back in play, and the retrograde extends these energies through March 20. Be cautious with new investments through this period, and keep in mind that the Communication Services sector will likely remain weak. Its conjunction with Mars today should be watched for another time of harsh, aggressive verbal and physical action that could affect markets tomorrow.
The planet Venus has entered the sign of Aries last weekend (Mar 6 – Mar 30), transferring from more peaceful, passive energies (Pisces) to an aggressive, full-speed ahead approach (Aries). Don’t fall in love with an investment, and continue to be aware of false information and/or break-outs. This planet conjunct both Neptune (March 7) and Saturn (March 8), which resulted in more fireworks on Monday, as we suggested in last week’s blog, as the Mars (ruler of Aries) aggression kicked in.
The planet Mars also entered Pisces earlier this week (Mar 2 – Apr 9), leaving behind the Aquarius challenging energies that had slowed Mars down (please see our Trader Transits - Mars square Saturn blog, dated 11-29-25). Mars formed a square with the planet Uranus at the end of last week, resulting in another sudden plunge in the technology sector. Mars’ overzealous energies can be dangerous in an uncertain market, so be sure not to FOMO into any speculative stocks for the time being.
The planet Jupiter finally ended its retrograde in the sign of Cancer this past Wednesday, March 11. The retrograde period brought Jupiter back to the 15th degree of Cancer, landing on the cusp of the United States Stock Market natal ascendant, which is located at 14 degrees. This point also symbolizes a tenacious, emotional, defense of the home, combined with Jupiter’s powerful expansive energies, which may ramp up again with the planet returning to prominence in March.
The planet Uranus remains in the sign of Taurus (money) until late April (25th), after finally ending its 6-month retrograde on February 4. As noted, there have already been several days of wild price swings since that date, a signature of Uranus. The planet returns to Gemini in about 6 weeks, where it will remain until May of 2033.
Finally, the long-awaited Saturn-Neptune conjunction arrived on Friday, Feb 27, the same day the Supreme Court (Saturn) made their decision regarding tariffs (Neptune). This conjunction traditionally causes a pull and push between structure and restriction (Saturn) and dreams and ideals (Neptune), which results in uncertainty. What happens next remains to be seen, and caution should be heeded as markets gyrate with no clear direction.
Leading sectors continued to include Energy and Utilities, typical in current economic/global conditions,as all others have fallen off. Current laggards, Real Estate, Consumer Discretionary, and Financials remained very low, which is not a positive indication in the short term. Sectors of the technology industry that are likely to continue their advance into the future include AI, robotics, quantum computing, and space development (with Pluto positioned in Aquarius, and Uranus in Gemini for many years to come – when it returns in April), though they will experience pullbacks along the way.
Gold (ruled by the Sun), and Silver (ruled by the Moon), rose the first day or so this week, before succumbing with the rest of the market. The Gold to Silver Ratio (covered in our publication) advanced about 1 point, ending the week at 62.3, after last week’s close of 61.2, slightly favoring gold as a better “value.” Both metals remain good buys after pullbacks, so long as economic conditions remain the same, with central banks continuing to buy, and Safe-Haven investments expected to remain popular. Bitcoin (ruled by Uranus)showed some signs of life, as Uranus has turned direct in Taurus (money). Its Fear & Greed Index now reads 30, rising from Extreme Fear to Fear territory, up 12 points from last week’s close of 18. Last week we suggested a possible bounce with the extremely low reading, though we remain cautious until a clear uptrend has developed.
***As always, this information is not intended to be financial advice, or any specific buy or sell recommendation, but rather a guide to assist the reader in some further understanding of current economic conditions/movements in the sky, and how they can affect moods, behaviors, world events, and financial markets.