FEAR & GREED INDEX 36
Weekly Update
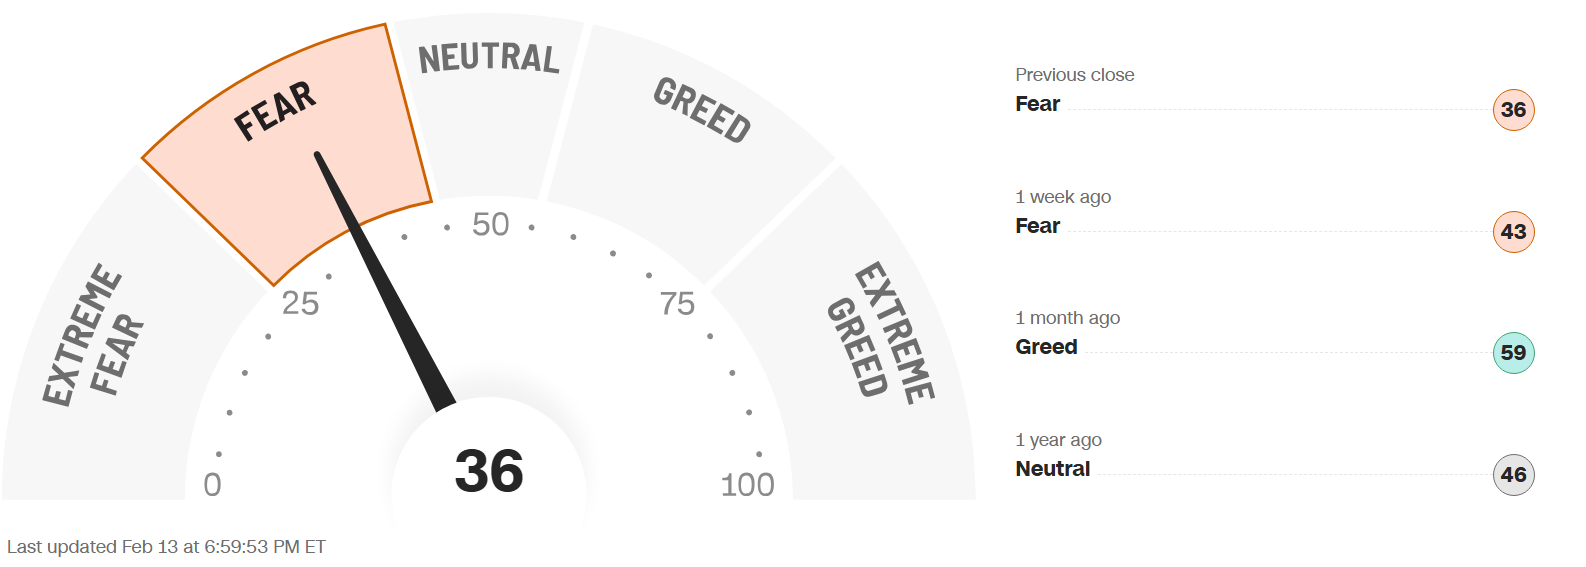
The Fear & Greed Index (found on cnn.com) is one of the easiest indicators to use to determine current market emotion. This simple to read gauge, highlighted in our publication When to Buy and When to Sell: Combining Easy Indicators, Charts, and Financial Astrology (available on Amazon), is measured in a range from 0-100, and currently reads 36 as of the close on Friday, February 13, 2026.
This figure dropped to the mid-Fear level, after another wild week (as expected), decreasing 9 points from last week’s close of 45. This was reflected in the S&P 500, which fell about 96 points, from 6,932 to 6,836.
The 4 major indexes’ 200-day MA (Moving Average) internal bullish sentiment is holding steady, as they continue to sit in the 60’s% range, though each index’ shorter-term 20 and 50-day MAs declined. The Nasdaq 100, however, has shown some cracks in the armor as it hovers around the bear territory 50% level.
The “Risk-On” sentiment oscillated throughout the week, turning to Risk-Off on Thursday, with a “Flight-to Quality” into treasuries. Early Friday, however, another sentiment change, based on strong employment and inflation reports, eased some fears for the time being. As a result, 10-year bond yields fell to a 2 ½ month low, closing the week at 4.05%, vs last week’s close of 4.21%, the first sign of a belief in the economic strength in quite some time.
The 7 internal factors used to formulate this gauge are listed on the screen (below):
Market Momentum – (S&P 500 vs its 125-day moving avg) = EXTREME FEAR
Market Volatility (measured by the VIX) = FEAR
Put to Call Ratio 5-day avg. (# of Puts (bearish) vs Calls (bullish) = EXTREME FEAR
Stock Price Strength (# of new 52-week highs vs new 52-week lows) = EXTREME GREED
Stock Price Breadth (# of shares rising vs falling on NYSE) = GREED
Safe-Haven Demand (which measures stocks vs bonds) = EXTREME FEAR
Junk Bond Demand (non-govt. bond yield spread) = FEAR
This week only 4 of these 7 factors changed levels, led by Market Momentum, which fell from Fear to Extreme Fear. This was reflected in the gauge itself dropping to Fear, and the VIX, which rose to Fear. As discussed, the seasonal volatility has returned, and mixed signals continue to keep uncertainty and risk aversion at heightened levels. Stock Price Breadth’s rise to Greed reflects a broadening market, indicating safer investments that hold less weight in indexes have become the leaders for the time being.
The VIX, measured by Market Volatility, had an interesting and inconsistent week, rising 3.4 points (19%), closing the week at 21.1, compared to last week’s close at 17.7. The crucial “20” level was pierced for the third time in less than a month, reaching almost 22 on Thursday. As we noted the past few weeks, volatility was likely to increase as February is one of the seasonally weakest months of the year for equities over the past few decades. The chip sector, however, does have strength historically around the middle of the month, so look for potential entry points.
News this week focused on the jobs market, which reported adding 130k positions (higher than expected), and an unemployment rate of 4.3%, a slight tick lower than expected. On Friday, the pre-market CPI (inflation gauge) report cited a lower Year-over-Year rate, which was also encouraging in the short term, though mixed earnings and economic reports continued to cause volatility for the third straight week.
As we also discussed the past few weeks, we have now officially entered the 2nd year of the Presidential Cycle, known as the Mid-Term Year, which has historically posted the worst returns of the 4-year cycle, at least leading up to the elections. Please see our Did You Know – About the Mid-Term Election Year blog, dated 12-27-25 for more details.
Astrologically, Aquarius season, ruled by the planet Saturn, will come to a close in a few days on Wednesday (Feb 18), giving way to Pisces season, ruled by Jupiter, (Feb 19 – Mar 20), which is the 12th sign of the zodiac. Please see our recent Sign Language – Pisces blog, dated 2-6-26 for full details. The challenging Saturn energies of Capricorn and Aquarius will now be replaced by the energies of Jupiter (expansive) and co-ruler Neptune (imaginative, secretive), which again causes uncertainty in the equities markets.
The planet Mercury entered the sign of Pisces on Friday, February 6, 2025, where it will remain until April 14, an unusually long time for one sign, due to its upcoming retrograde in a few weeks (February 26 - March 20). Miscommunication, false reports, and uncertainty on a global basis are back in play, and the retrograde will extend these energies. Be cautious with new investments through this period, and keep in mind that the Communication Services sector will likely remain weak.
The planet Venus has also entered the sign of Pisces (as of Feb 10), remaining until March 6, symbolizing dreams and irrational exuberance. Don’t fall in love with an investment, and beware false information. Its upcoming square aspect with Uranus, on February 27, also signifies sudden impulsive financial events.
The planet Mars remains in the sign of Aquarius (Jan 23 - March 2), leaving behind the Capricorn challenging energies that had slowed Mars down (please see our Trader Transits - Mars square Saturn blog, dated 11-29-25). The same overzealous energies can be dangerous in an uncertain market, so be sure not to FOMO into any speculative stocks for the time being.
The planet Jupiter remains in retrograde in the sign of Cancer (until March 11), and as previously discussed, Jupiter has very powerful expansive energies, which have weakened a bit recently, but may ramp up again with the planet returning to prominence in March.
Finally, the planet Uranus finally ended its 6-month retrograde, turning “direct” on Wednesday February 4, but remains in the sign of Taurus (money) until late April. Right on cue, the equities markets experienced wild swings on Wednesday (the 4th), in both directions, indicative of the Uranus energies, which have continued. The planet will also form a square aspect to the Sun this coming Tuesday (Feb 17), which could result in another wild day, directly after the 3-day holiday weekend. Uranus returns to Gemini on April 25, where it will remain until May of 2033.
Leading sectors, with over 50% of stocks trading over their 200-day MAs, continues to include Industrials, Utilities, Basic Materials, and Energy (safer, higher yielding industries), while the laggards, Infotech and Communicative Services (which basically led all of 2025), have diverged. Real Estate continues to improve as high paying Real Estate Investment Trusts (REITS) are returning to favor. Sectors of the technology industry that are likely to continue their advance into the future include AI, robotics, quantum computing, and space development (with Pluto positioned in Aquarius, and Uranus in Gemini for many years to come – when it returns in April), though they will experience pullbacks along the way.
Gold (ruled by the Sun), and Silver (ruled by the Moon), slowly increased the first half of the week, dropped heavily on Thursday, with a rotation into bonds, then recovered a bit on Friday. The recent decline a couple of weekends ago was not normal (as silver dropped 30%!), for many reasons, though we noted in the past few weeks the surge was unsustainable. The Gold to Silver Ratio (covered in our publication) dropped 3.4 points, closing at 60.4 compared to last week’s close of 63.8. Silver had been outpacing gold, though has been slowly evening off, lessening the imbalance. Both remain good buys after pullbacks so long as economic conditions remain the same, with central banks continuing to buy, and Safe-Haven investments expected to remain popular. Bitcoin (ruled by Uranus) continued to struggle, but could experience a sharp upswing, that may have started on Friday, as the planet has turned direct in Taurus (money). Stay cautious with crypto until a clear uptrend has developed.
***As always, this information is not intended to be financial advice, or any specific buy or sell recommendation, but rather a guide to assist the reader in some further understanding of current economic conditions/movements in the sky, and how they can affect moods, behaviors, world events, and financial markets.