FEAR & GREED INDEX 39
Weekly Update
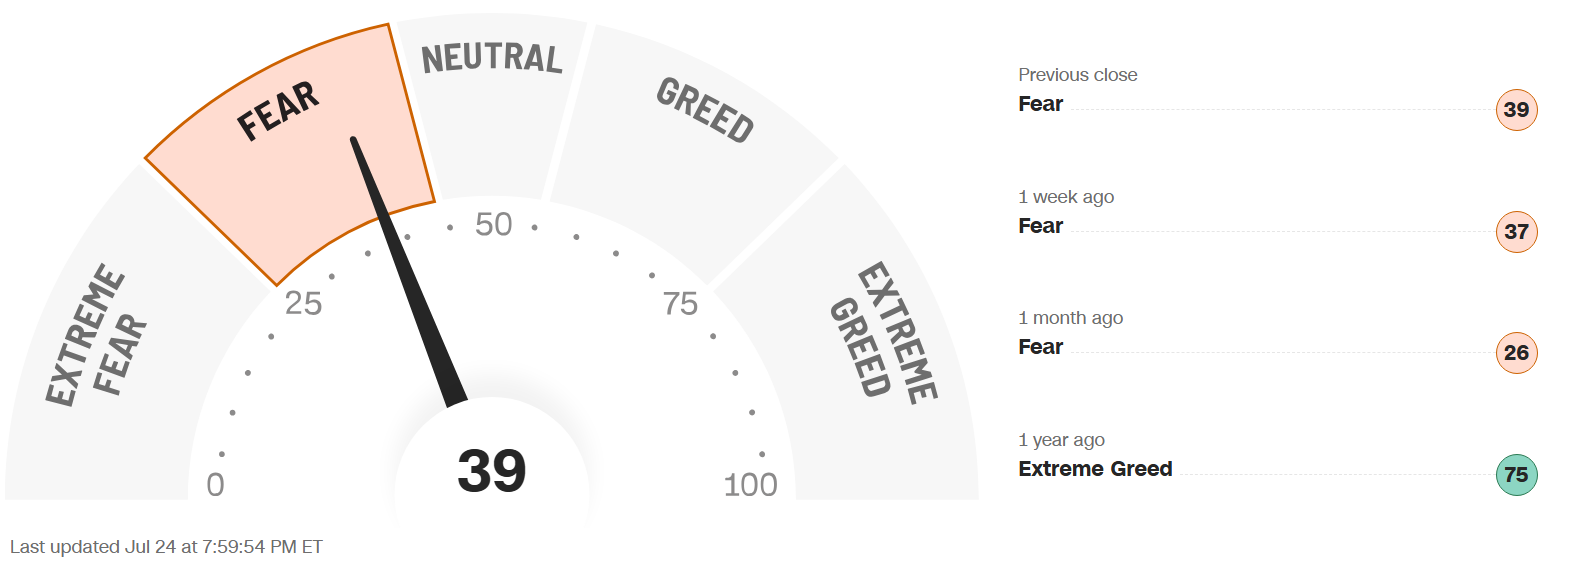
The Fear & Greed Index (found on cnn.com) is one of the easiest indicators to use to determine current market emotion. This simple to read gauge, highlighted in our publication When to Buy and When to Sell: Combining Easy Indicators, Charts, and Financial Astrology (available on Amazon), is measured in a range from 0-100, and currently reads 39 as of the close on Friday, July 24, 2026.
The gauge remained in the Fear category, rising only 2 points from last week’s close of 37. This was reflected in the S&P 500, which declined 47 points, from 7,459 to 7,412, despite a positive beginning to earnings season. Technology stocks were the culprit as semi-conductors continued their slide after a massive run-up.
The 7 internal factors used to formulate this gauge are listed on the screen (below):
Market Momentum – (S&P 500 vs its 125-day moving avg) = FEAR
Market Volatility (measured by the VIX) = NEUTRAL
Put to Call Ratio 5-day avg. (# of Puts (bearish) vs Calls (bullish) = FEAR
Stock Price Strength (# of new 52-week highs vs new 52-week lows) = FEAR
Stock Price Breadth (# of shares rising vs falling on NYSE) = EXTREME FEAR
Safe-Haven Demand (which measures stocks vs bonds) = GREED
Junk Bond Demand (non-govt. bond yield spread) = NEUTRAL
This week, 2 of these 7 factors changed categories, as momentum levels all remained in Fear levels, as did the all-important Put to Call Ratio. Safe-Haven Demand flipped back from Fear to Greed territory by week’s end, as non-risky sectors came back into favor.
Moving Averages’ (MAs) bullish sentiment continued to weaken, with the longer-term 200-days slipping slightly to 56% (vs 57% last week), while shorter-term MAs plunged to 42% on the 20-MA (vs 52% last week) and 53% on the 50-MA (vs 56% last week), especially the Nasdaq, which fell into the 32 - 35% range on the 20-MA. Energy (with the military conflict re-ignited) and Financials (good earnings reports), which are always important for a bullish market, remained strong, while Infotech and Communications continued their weakness.
The “Risk-On” sentiment decreased this week with inflation and high interest concerns, as markets remained difficult to swing trade. The VIX, (market volatility), closed flat, though the week was fairly volatile, ending up just 0.1 points, at 18.8, vs last weeks close of 18.7. As we often note, any break-through of the crucial “20” mark suggests a pullback, so keep an eye on this gauge. The recent intraday volatility continued as well, with frequent reversals. 10-yr bond yields rose .23 points to 4.68%, from last week’s close of 4.45%, as they reached a 19-year high. Earnings season has begun again, with positive projections for the 2nd Quarter of a 23% average increase, which will certainly start to move some stocks based on confirmation or disappointment. 2nd Quarter earnings have been excellent so far, after about ¼ of companies have reported, but the forward-looking market is not convinced about upcoming quarters.
A light economic calendar this week focused on the Leading Economic Indicator (LEI), which was down slightly, and weaker-than-expected, though the first 6 months of 2026 has shown improvement from the same period last year. The Producers Manufacturing Index (PMI) score on Friday improved to 53.6, an 8-month high, indicating economic expansion.
Astrologically, Leo season (self, leadership), officially began on Wednesday, July 22. Leo, a fixed,fire sign, is known for more weakness in market performance than its predecessor, Cancer, which is historically the 2nd strongest. Please review our Sign Language – Leo blog, dated 7-8-26 for more details.
Current shorter-term transits/aspects of note include the completion of the current Mercury Retrograde period (in Cancer) on Thursday, July 23, which ultimately resulted in a market decline of 31 points on the S&P 500. Though this is not a significant drop, it came at a very strong historically seasonal period, which was basically negated. The planet Venus remains in the sign of Virgo (through Aug 6), symbolizing a more critical, meticulous, and selective (Virgo) market in the short-term. As is typical of Virgo, the “loved” stocks will flourish, while the “hated” will be punished, with little in between. This coincides with the beginning of “earnings season,” which usually distinguishes the strong and weak companies. Leading company IBM was a perfect example of this concept, as it was punished 25% after a recent disappointing earnings report.
Longer-term, the planet Jupiter has settled intothe sign of Leo (entered June 30), where it will remain until July 26, 2027, highlighting fashion, self-pleasing products, and travel (signified by the Consumer Discretionary sector), as well as leadership, defense, and gold. Stocks in those sectors had shown improvement (as expected), which could continue along with rising consumer sentiment, though Venus’ influence has now moved out of Leo. Please refer to our Trader Transits – Jupiter in Leo blog, dated 6-12-26, for further information. Keep in mind that travel-related stocks are also sensitive to oil prices, which are vulnerable to the military conflict status (or “perceived” status). Also, as discussed heavily in recent months, Uranus (sudden, unexpected events/high technology) will remain in the sign of Gemini (communications, transportation, advanced technology) until 2033. Uranus’ energies have been on full display of late, with quick, unexpected reversals, and, as we’ve also mentioned in the past several weeks, do not be “surprised” if this type of market action continues with these other planetary transits. Please also review our Trader Transits – Uranus in Gemini blog, dated 3-30-26, for more details.
As we have noted for over 1 year now, sectors of the technology industry that are likely to continue their advance into the future include AI, robotics, quantum computing, and space development, with both Pluto positioned in Aquarius, and Uranus in Gemini for many years to come, though they will experience pullbacks (sometimes sizeable) along the way.
Gold (ruled by the Sun), and Silver (ruled by the Moon), improved a bit during the week, peaking on Wednesday, before pulling back slightly. The Gold to Silver Ratio closed at 69.6, down 2.2 points from last week’s close of 71.8, remaining rather neutral. As we continue to stress, both metals remain good buys after pullbacks, so long as central banks continue to buy, which they are, and Safe-Haven investments remain popular, which is expected.
Finally, Bitcoin (ruled by Uranus) seems to have found a bottom, hopefully, and is currently consolidating. Its Fear & Greed Index closed at 35, vs last week’s close of 33, up slightly, but basically unchanged, as the asset continues to consolidate. The Clarity Act, a bill designed to regulate the cryptocurrency and blockchain spaces in the U.S., and could boost the sector, advanced through the committee on Friday, and now awaits Senate approval. Please see our Did You Know? – About The Clarity Act blog, later today, for further information.
***As always, this information is not intended to be financial advice, or any specific buy or sell recommendation, but rather a guide to assist the reader in some further understanding of current economic conditions/movements in the sky, and how they can affect moods, behaviors, world events, and financial markets.