FEAR & GREED INDEX 62
Weekly Update
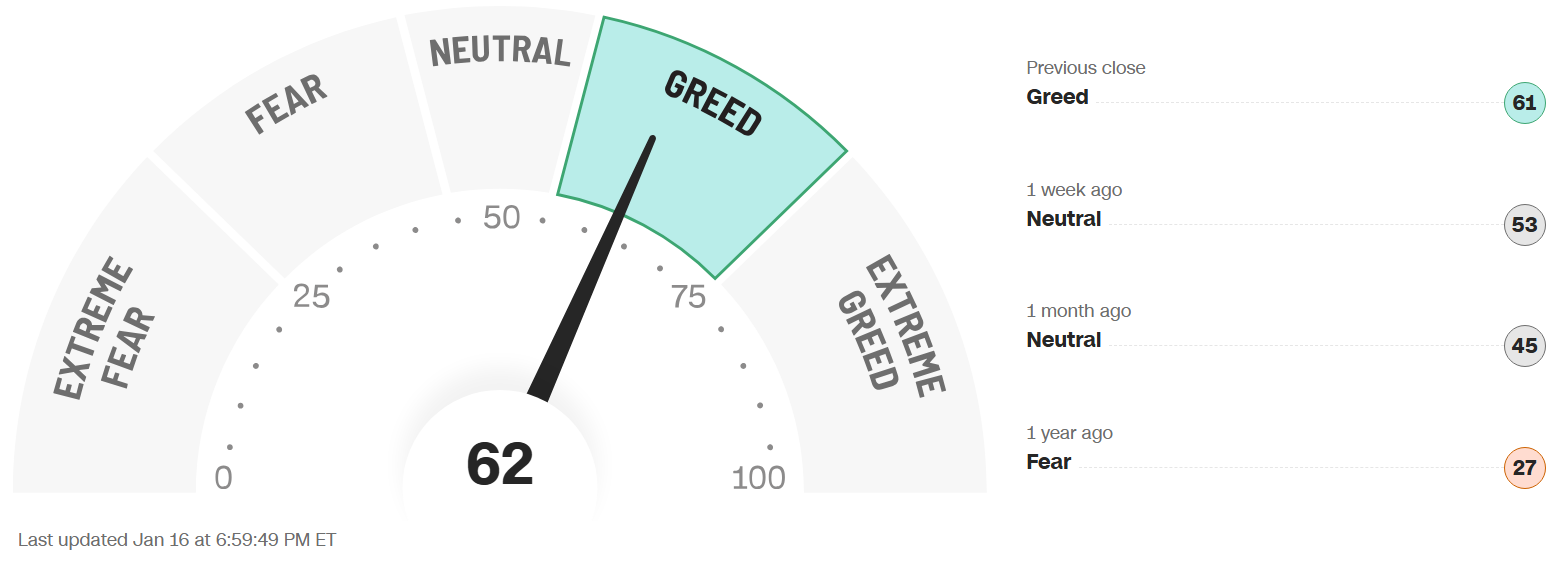
The Fear & Greed Index (found on cnn.com) is one of the easiest indicators to use to determine current market emotion. This simple to read gauge, highlighted in our publication When to Buy and When to Sell: Combining Easy Indicators, Charts, and Financial Astrology (available on Amazon), is measured in a range from 0-100, and currently reads 62 as of the close on Friday, January 16, 2026.
This figure moved squarely into the Greed level, for the first time in almost 1 month, after rising 11 points from last week’s close of 51. The S&P 500, however, closed the week slightly down, falling 26 points, from 6,966 to 6,940, creating a bit of divergence, due to the technology stocks within the S&P that declined with increased volume that has returned to more normal levels.
The 4 major indexes’ (S&P 500, Nasdaq, Dow Jones Industrial, and Russell 2000), internal bullish sentiment, regarding their 200-day moving averages, has remained, as they continue to sit in the high 60’s% range, with the DIA leading at 73%, down 10% from last week. The Nasdaq made up some lost ground, mainly due to semiconductors gains on several positive earnings reports. Each index’ shorter-term 20 and 50-day MAs have remained steady, helping to maintain the 200 MAs. The January Effect, when “new” money traditionally is added to pensions, 401k’s, and invested in small caps (IWM), remains in play with the IWM continuing to show solid results.
The “Risk-On” sentiment returned to some extent this week as well, reflected by the improvement in the chips sector. 10-year bond yields rose again, however, closing the week at 4.23%, vs last week’s close of 4.17%, continuing to suggest the bond market is not quite convinced that the economy is in good shape. Yields on long-term bonds are likely to stay elevated until that sentiment changes.
The 7 internal factors used to formulate this gauge are listed on the screen (below):
Market Momentum – (S&P 500 vs its 125-day moving avg) = NEUTRAL
Market Volatility (measured by the VIX) = NEUTRAL
Put to Call Ratio 5-day avg. (# of Puts (bearish) vs Calls (bullish) = EXTREME FEAR
Stock Price Strength (# of new 52-week highs vs new 52-week lows) = EXTREME GREED
Stock Price Breadth (# of shares rising vs falling on NYSE) = NEUTRAL
Safe-Haven Demand (which measures stocks vs bonds) = EXTREME FEAR
Junk Bond Demand (non-govt. bond yield spread) = EXTREME GREED
This week 4 of these 7 factors changed levels, as most momentum categories are now Neutral. The Put to Call Ratio continues to reflect Fear sentiment, however, suggesting more possible gains on the horizon, as Stock Price Strength also remains strong. Finally, Safe-Haven Demand, fell to Extreme Fear levels, a sign of investor uneasiness.
The VIX, measured by Market Volatility, oscillated a bit during the week, closing a bit higher at 15.8, compared to last week’s close at 14.5, as the expected increase in volatility started to show. The crucial “20” level still has not been approached since November 24, and, as noted the last few weeks, the gauge remains at lower levels where a reversal is probable. Look for a continued rise in volatility in the near future.
News this week focused on the CPI (inflation gauge) which was reported on Tuesday at 2.6 Year-over-Year, vs an expected 2.7. The perceived good news had a positive effect on bonds initially, as equities rose. That was short-lived, however, as bonds yields reversed higher and stocks cooled. Watch for continuing shifts with the increased volatility.
As we also discussed the past few weeks, we have now officially entered the 2nd year of the Presidential Cycle, known as the Mid-Term Year, which has historically posted the worst returns of the 4-year cycle, at least leading up to the elections. Please see our Did You Know – About the Mid-Term Election Year blog, dated 12-27-25 for more details.
Astrologically, Capricorn season (ruled by the planet Saturn) ends tomorrow, January 19, as we move into Aquarius season. Please see our recent Sign Language – Aquarius blog, dated 1-6-26 for full details. Though the Saturn challenging energies continue (as Saturn also rules Aquarius), the collective symbolism of Aquarius has been reflected in the broadening market (more stocks rising vs falling).
The planet Mercury, will also enter the sign of Aquarius on Tuesday, January 20 (through Feb 6), as earnings season announcements will again affect sectors and specific stocks. Mercury also conjuncts Mars over this weekend, and though the equities markets are closed until Tuesday, watch for some aggressive global verbiage/announcements that could affect the markets next week. Also, the next Mercury Retrograde occurs in a little over one month, from February 26 through March 20 (in Pisces season), which will likely coincide with the increased volatility, we consistently note.
The planet Venus, also ingressed the sign of Aquarius yesterday, Jan 17 (lasting through Feb 10), symbolizing some financial benefit across the masses, but also conjoins Pluto on Monday, Jan 19, signifying transformational financial conditions.
The planet Mars will also transit Aquarius from this coming Friday, Jan 23, remaining until March 2, where Saturn (ruler of Capricorn) energies have created a few challenges and slowed Mars down (please see our Trader Transits - Mars square Saturn blog, dated 11-29-25). Please also note that all 3 of these planets will form conjunctions with the planet Pluto in the next week (between the 19th and 27th of January), which is discussed in the same Sign Language – Aquarius blog, potentially resulting in more financial and political chaos across the globe.
The planet Jupiter remains in retrograde in the sign of Cancer (until March 11), and as previously discussed, Jupiter has very powerful expansive energies, which may weaken a bit for the time being.
Finally, the planet Uranus, which is currently in retrograde until February 4, remains in the sign of Taurus (money), and will not return to Gemini until April, 2026. This 6-month re-visit to the sign of money (ruled by Venus), could create more shocks to the markets, in either direction, so beware. Please review our Planet Power – Uranus Retrograde blog, dated 8-27-25 for further details.
Leading sectors, with over 50% of stocks trading over their 200-day MAs, has shifted with the current “sector rotation” into areas including Industrials and Energy, with the increasing expectation of military conflict, and also Real Estate, which has suddenly surged. The only real laggard at the time is Communicative Services (which basically led all of 2025), further indicative of the current shift. Sectors of the technology industry that are likely to continue their advance into the future include AI, robotics, quantum computing, and space development (with Pluto positioned in Aquarius, and Uranus in Gemini for many years to come – when it returns in April), but it will experience pullbacks along the way.
Gold (ruled by the Sun), and Silver (ruled by the Moon), were volatile this week, but both again ended the week about even, with silver slightly higher. The Gold to Silver Ratio (covered in our publication), declined again, closing at 50.9, compared to last week’s close of 56.3, remaining very low, suggesting gold may be a better “value” buy at the current time. Both remain good buys after pullbacks (which they were due for) in the current economic conditions, as central banks continue to buy, and Safe-Haven investments remain popular. Bitcoin (ruled by Uranus) had a solid week, but remains skittish, as the Uranus retrograde is nearing its end.
***As always, this information is not intended to be financial advice, or any specific buy or sell recommendation, but rather a guide to assist the reader in some further understanding of current economic conditions/movements in the sky, and how they can affect moods, behaviors, world events, and financial markets.