FEAR & GREED INDEX 63
Weekly Update
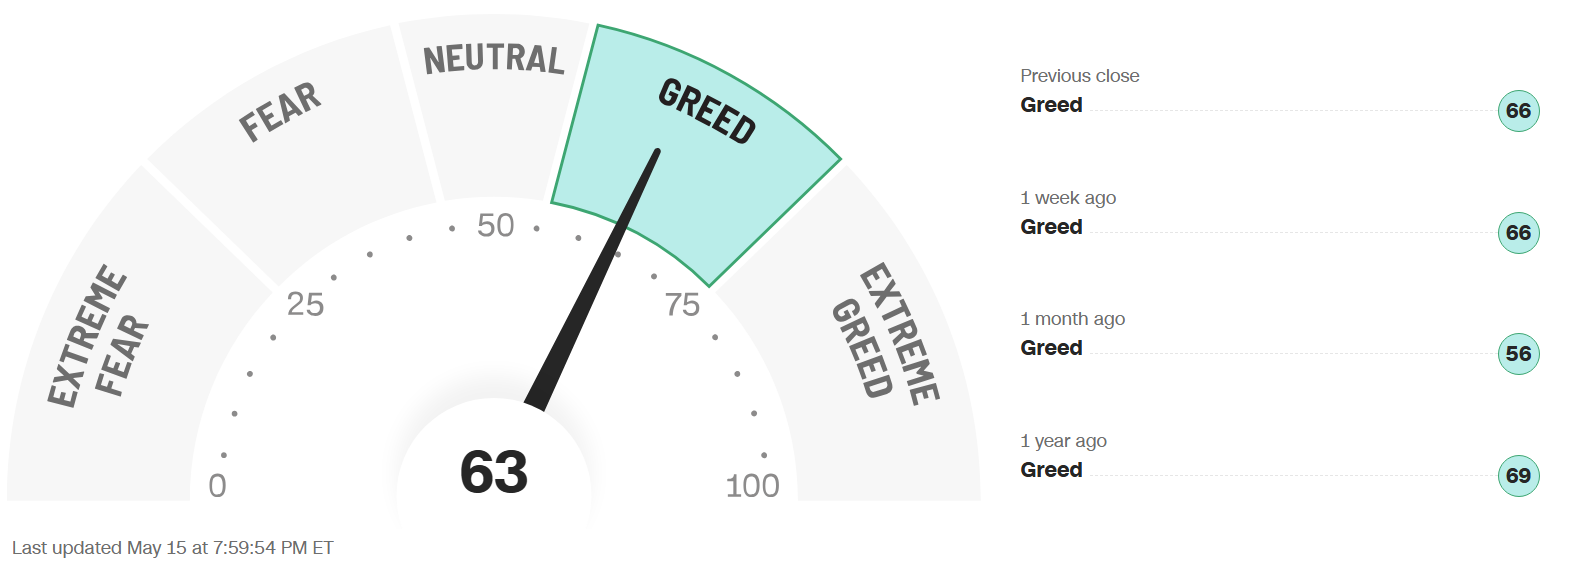
The Fear & Greed Index (found on cnn.com) is one of the easiest indicators to use to determine current market emotion. This simple to read gauge, highlighted in our publication When to Buy and When to Sell: Combining Easy Indicators, Charts, and Financial Astrology (available on Amazon), is measured in a range from 0-100, and currently reads 63 as of the close on Friday, May 15, 2026.
The gauge hovered around the mid-Greed category all week, before finally closing down 4 points, from last week’s close of 67, after a marketplunge on Friday. The S&P 500 did eke out a gain of 10 points, however, rising from 7,398 to 7,408.
The 4 major indexes’ 200-day MAs (Moving Averages) did not fare as well, though the internal sentiment remained in the bullish zone. The number of stocks making new highs declined on all indexes, falling closer to the 50% mark, with the S&P 500 barely over at 51%. The shorter-term 20 and 50-day MAs also suffered this week with the 20’s well below 50% and the 50’s hovering right around that mark.
The “Risk-On” sentiment continued all week, until Friday, with the technology sector strength. 10-yr bond yields, however, rose to a level not seen in many years, at 4.6% vs last week’s close of 4.36%, with high inflation reports and hints of interest rate hikes re-surfacing. Stagflation concerns, when the economy is slowing and inflation is rising, had faded for a short time, but also re-emerged as a concern.
The 7 internal factors used to formulate this gauge are listed on the screen (below):
Market Momentum – (S&P 500 vs its 125-day moving avg) = EXTREME GREED
Market Volatility (measured by the VIX) = NEUTRAL
Put to Call Ratio 5-day avg. (# of Puts (bearish) vs Calls (bullish) = EXTREME GREED
Stock Price Strength (# of new 52-week highs vs new 52-week lows) = NEUTRAL
Stock Price Breadth (# of shares rising vs falling on NYSE) = FEAR
Safe-Haven Demand (which measures stocks vs bonds) = EXTREME GREED
Junk Bond Demand (non-govt. bond yield spread) = FEAR
This week, 3 of these 7 factors changed levels, as momentum has started to fade. Both the Stock Market Strength and Breadth categories fell from Greed levels. The all-important Put to Call Ratio (used more by short-term traders) continues to be heightened at Extreme Greed, reflecting the enthusiasm of the markets prior to Friday, helping to indicate a possible pullback, which occurred (hopefully not started) on Friday.
The VIX, measured by Market Volatility, rose for the 2nd straight week, closing up 1.2 points at 18.4, vs last weeks close of 17.2, creeping close to the crucial “20” mark (that is hasn’t seen since April 8) at one point on Friday. Any break-through of that level would suggest a larger pullback/correction.
After another week of geopolitical conflict in the Middle East, the POTUS visit to China, energy prices, and inflation concerns interrupted the recent rally. Markets had essentially assimilated the military conflict into the market to some extent, but that may be changing again with these renewed issues. As noted over the last couple of weeks, the 6-week bullish rally continued to show signs of divergence and over-extended conditions to the upside, as the gains were not as widespread through the sectors.
Economic data was again mixed this week, with steady job conditions and solid retail sales. Inflation numbers, however, were way above expectations with both the PPI (Producer’s Price Index and the CPI (Consumer’s Price Index) almost doubling, sending rates higher and Consumer Sentiment lower. Pressure is mounting on bonds and the fragile state of the market. The naming of a new Fed Chair also initially makes the status of rates uncertain.
Astrologically, as we traveled through Taurus season (Apr 20 – May 20), energies stabilized (as expected) from the Aries aggression of late March and early April, which was reflected in the VIX. Taurus (the 2nd sign of the zodiac, ruled by Venus), is a money sign, whose attributes also include logical, down-to-earth, calm energies, with a positive financial theme. As we approach the last few days of this season, and move into Gemini season (May 21 – June 20), volatility usually increases, in this air, 2-sided sign.
Mercury, the planet of trading, also enters the sign of Gemini (one of its two “home” signs) this weekend, putting extra focus communications and speech. Proceed with caution, however, as the markets will likely “even” out with the sign’s push and pull energies.
The planet Venus’ transit through Gemini (which included a conjunction with Uranus) was favorable for the Communications, Transportation/Airlines, and high technology sectors, as noted, and it will now enter the sign of Cancer tomorrow, May 18. This provides a shift to more “love of the home” stocks and sectors, including cyber-security, and real estate/home improvement.
The planet Mars will also change signs, transiting from the sign of Aries (its “ruling” sign with Scorpio), to the sign of Taurus today, May 17, which is also the birth date of the U.S. Stock Market, cooling from its ultra-aggressive energies to more stable conditions. Mars in this sign tends to symbolize a lean toward longer-term plans (investments) rather than quick aggressive action. Tomorrow’s market could be choppy with these energies.
As you can see, Mercury, Venus, and Mars (the shorter-term transiting planets) will all change signs within 2 days this weekend, which suggests more short-term uncertainty and volatility.
The much-anticipated Uranus (sudden, unexpected events/high technology) entry into the sign of Gemini (ruled by Mercury - considered a lower-level Uranus), is now complete, where it will remain until 2033. Gemini, like Uranus, represents high intelligence, communications, and technology, signifying major advances in those industries. Uranus’ technology energies were on full display again this week with solid gains followed by a quick, unexpected reversal. Do not be “surprised” if this type of market action continues with Mercury and Uranus energies. Please review our Trader Transits – Uranus in Gemini blog, dated 3-30-26, for more details.
Leading sectors continued to include Energy and Infotech, while Utilities were again hit hard with the continued Risk-On sentiment until Friday. That could easily reverse should the sentiment suddenly change to Risk-Off. Consumer Discretionary continues to struggle with inflated prices and low Consumer Sentiment figures. Real Estate, which had been rising,had a tougher week with rising interest rates, but could reverse with Venus’ ingress to Cancer.
As we continued to stress, sectors of the technology industry that are likely to continue their advance into the future include AI, robotics, quantum computing, and space development, with both Pluto positioned in Aquarius and Uranus in Gemini, for many years to come, though they will experience pullbacks along the way.
Gold (ruled by the Sun), and Silver (ruled by the Moon), drifted downward throughout the week, before plunging on Friday morning. The Gold to Silver Ratio closed at 59.7, rising 1.1 point from last week’s close of 58.6. This reading continues to remain rather neutral, but slightly favors gold. Both metals remain good buys after pullbacks, so long as economic conditions remain the same, with central banks continuing to buy, and Safe-Haven investments expected to remain popular. Bitcoin (ruled by Uranus) was very volatile this week, moving down Monday through Wednesday, surging on Thursday, only to give it all back on Friday. As noted, Mercury in Gemini (with Uranus), also symbolizes advanced technology, including cryptocurrencies. Its Fear & Greed Index now reads 45, remaining in Neutral territory, closing slightly lower after last week’s close of 49.
***As always, this information is not intended to be financial advice, or any specific buy or sell recommendation, but rather a guide to assist the reader in some further understanding of current economic conditions/movements in the sky, and how they can affect moods, behaviors, world events, and financial markets.