FEAR & GREED INDEX 67
Weekly Update
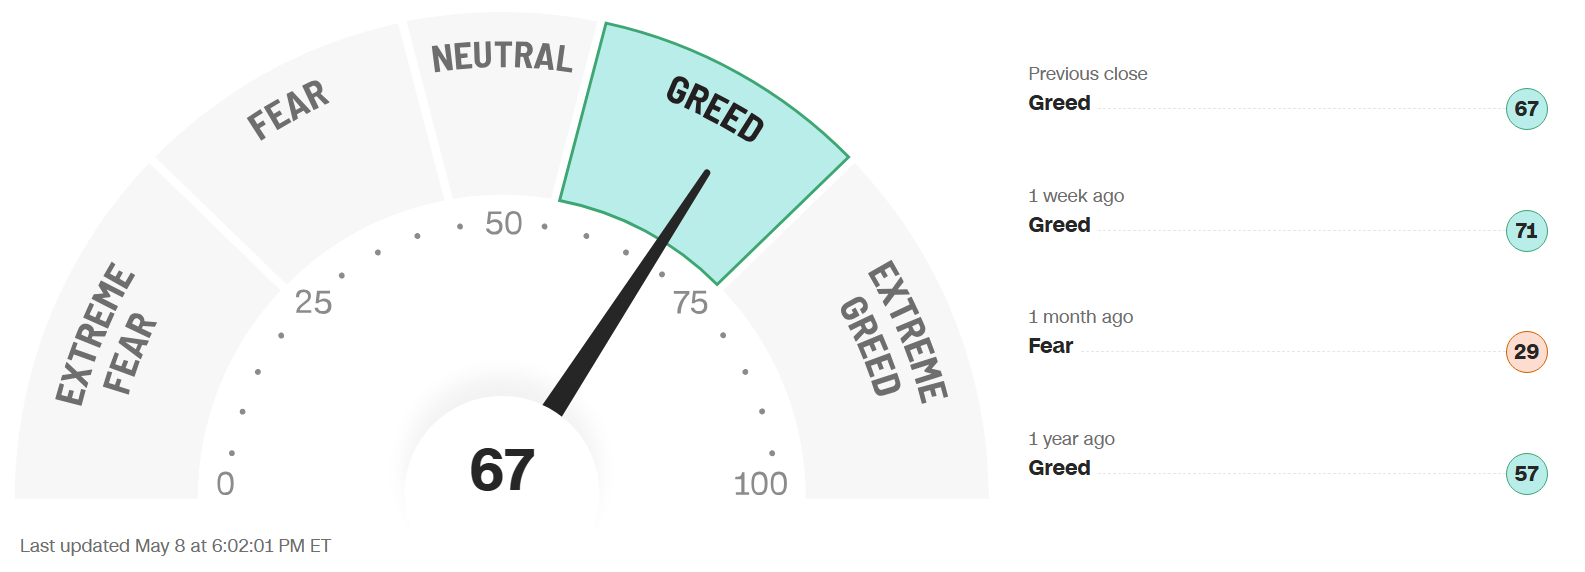
The Fear & Greed Index (found on cnn.com) is one of the easiest indicators to use to determine current market emotion. This simple to read gauge, highlighted in our publication When to Buy and When to Sell: Combining Easy Indicators, Charts, and Financial Astrology (available on Amazon), is measured in a range from 0-100, and currently reads 67 as of the close on Friday, May 8, 2026.
The gauge barely moved all week, remaining in the mid-Greed category, closing unchanged from last week’s close of 67. The S&P 500, however, showed steady progress, as it closed up 3 of 5 days for a total of 168 points, from 7,230 to 7,398. The up days were more significant than the down days, and as a result the strong recovery since the end of March has again exceeded all-time highs.
The 4 major indexes’ 200-day MAs (Moving Averages) internal sentiment remained steadily in the bullish zone, with the number of stocks making new highs safely exceeding 50% on all indexes, including recent laggard Nasdaq 100, now at 62%, even with the Russell 2000. The shorter-term 20 and 50-day MAs also remained steady with the same two indexes leading.
The “Risk-On” sentiment also continued this week with the technology sector strength, and 10-yr bond yields basically even at 4.36% vs last week’s close of 4.37%, as interest rates remain unchanged for the foreseeable future. Stagflation concerns, when the economy is slowing and inflation is rising, has faded for the time being, with a very positive start to earnings season.
The 7 internal factors used to formulate this gauge are listed on the screen (below):
Market Momentum – (S&P 500 vs its 125-day moving avg) = EXTREME GREED
Market Volatility (measured by the VIX) = NEUTRAL
Put to Call Ratio 5-day avg. (# of Puts (bearish) vs Calls (bullish) = EXTREME GREED
Stock Price Strength (# of new 52-week highs vs new 52-week lows) = GREED
Stock Price Breadth (# of shares rising vs falling on NYSE) = GREED
Safe-Haven Demand (which measures stocks vs bonds) = EXTREME GREED
Junk Bond Demand (non-govt. bond yield spread) = EXTREME GREED
This week, 2 of these 7 factors changed levels, as the momentum categories remained at Greed levels. The all-important Put to Call Ratio (used more by traders) flipped again, from Fear to Extreme Greed, reflecting the enthusiasm of the markets, and suggesting a possible pullback on the horizon.
The VIX, measured by Market Volatility, remained calm all week, closing 0.2 points higher at 17.2, vs last weeks close of 17. The gauge again closed beneath the crucial “20” danger-zone level all week, where it has remained since April 8, supporting the 5-week long recovery.
After yet another week, the geopolitical conflict in the Middle East, and energy prices, have been assimilated into the market to some extent. Though still vulnerable to verbal comments regarding the conflict, the reaction is not as strong as it has been recently. Despite the bullish rally, there continues to be signs of divergence and over-extended conditions to the upside, and a consolidation would help ease the pressure of a large pullback.
Economic data was mainly positive this week, with solid ADP/Jobs, Manufacturing, and Housing reports (though mortgage applications slid for the 2nd straight week due to rising interest rates). On the negative side was Consumer Sentiment, which again fell to all-time lows at 48.2, and Consumer Credit, which doubled. This can be interpreted in different ways, either as simply more spending (bullish) or individuals needing to put more purchases on credit (bearish), but either way it creates more debt (bearish).
Astrologically, as we continue through Taurus season (Apr 20 – May 20), energies have stabilized (as expected) from the Aries aggression of late March and early April. Taurus (the 2nd sign of the zodiac, ruled by Venus), is a money sign, whose attributes also include logical, down-to-earth, calm energies, with a positive financial theme. As noted, and expected, market volatility (VIX) calmed in the 2nd half of April, and continued through the first week of May.
Mercury, the planet of trading, entered the sign of Taurus last weekend, only remaining until next weekend, May 16. The expected strong financial reports, which began with many positive earnings from most banks and financial institutions, has now reached many of the chip and semi-conductor companies as well. Proceed with caution, as the markets will likely “even” out.
The planet Venus recently entered Gemini with a conjunction with Uranus, on Saturday, April 25. Venus in Gemini is favorable for the Communications, Transportation/Airlines, and high technology sectors, all of which have responded positively, as it transits Gemini for another week, through May 18.
The planet Mars will transit from the sign of Aries (its “ruling” sign with Scorpio), to the sign of Taurus on May 17 (birth date of the U.S. Stock Market), cooling from its ultra-aggressive energies to more stable conditions. Mars in its “home sign,” combined with the square it formed with the planet Uranus a few weeks ago, resulted in vicious reversals in the technology sector, as also expected.
As you can see, Mercury, Venus, and Mars (the shorter-term transiting planets) will all change signs within 2 days next weekend, which could be met with more short-term uncertainty and volatility.
The much-anticipated Uranus (sudden, unexpected events/high technology) entry into the sign of Gemini (ruled by Mercury - considered a lower-level Uranus), is now complete, where it will remain until 2033. Gemini, like Uranus, represents high intelligence, communications, and technology, signifying major advances in those industries. Uranus’ technology energies were on full display again this week with solid gains. Do not be “surprised” if it continues, or sharply reverses after the huge rally, so heed caution. Please review our Trader Transits – Uranus in Gemini blog, dated 3-30-26, for more details.
Leading sectors Utilities and Energy were hit hard with the continued Risk-On sentiment, while Consumer Discretionary continues to struggle with inflated prices and low Consumer Sentiment figures. Real Estate continued upward off recent lows, while Infotech and Communicative Services has also increased, as we have mentioned with the Mercury transit.
As we continued to stress, sectors of the technology industry that are likely to continue their advance into the future include AI, robotics, quantum computing, and space development, with both Pluto positioned in Aquarius, and Uranus in Gemini, for many years to come, though they will experience pullbacks along the way.
Gold (ruled by the Sun), and Silver (ruled by the Moon), rose throughout the week, after a recent slump. The Gold to Silver Ratio (covered in our publication) finished the week at 58.6, a 2.6-point drop from last week’s close of 61.2, remaining rather neutral, but slightly favoring gold. Both metals remain good buys after pullbacks, so long as economic conditions remain the same, with central banks continuing to buy, and Safe-Haven investments expected to remain popular. Bitcoin (ruled by Uranus) was a bit more volatile this week (with Mercury in Taurus), but ended slightly positive. With Uranus recently leaving Taurus, its ingress into Gemini (symbolizing technology/transportation) accompanied by Venus (money) last week continues the positive sentiment that began with Venus in Taurus (both symbolizing money). Its Fear & Greed Index now reads 49, remaining in Neutral territory, closing slightly higher after last week’s close of 46.
***As always, this information is not intended to be financial advice, or any specific buy or sell recommendation, but rather a guide to assist the reader in some further understanding of current economic conditions/movements in the sky, and how they can affect moods, behaviors, world events, and financial markets.