FEAR & GREED 45
Weekly Update
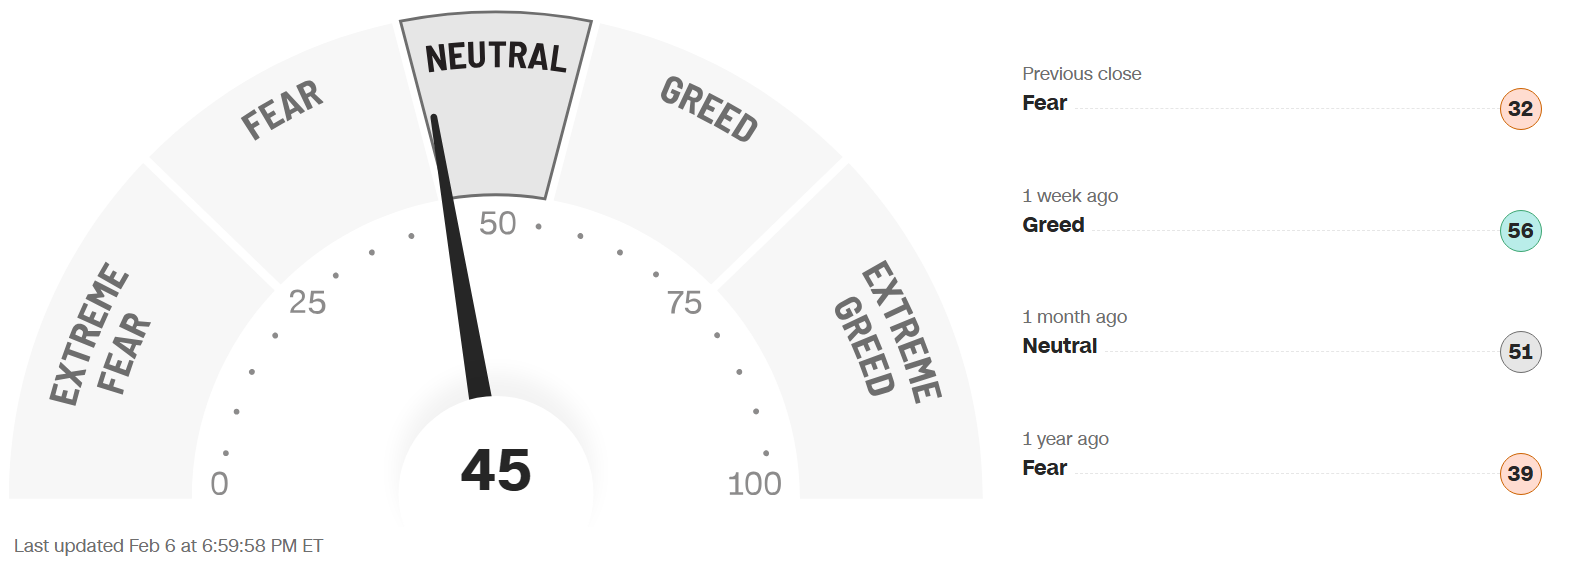
The Fear & Greed Index (found on cnn.com) is one of the easiest indicators to use to determine current market emotion. This simple to read gauge, highlighted in our publication When to Buy and When to Sell: Combining Easy Indicators, Charts, and Financial Astrology (available on Amazon), is measured in a range from 0-100, and currently reads 45 as of the close on Friday, February 6, 2026.
This figure slipped back to the low Neutral level, after a wild week, falling 13 points from last week’s close of 58. Despite the drop, the S&P 500 closed only 7 points lower, after Friday’s massive rally, from 6,939 to 6,932.
The 4 major indexes’ 200-day MA (Moving Average) internal bullish sentiment remained steady, as they continue to sit in the 60’s% range, except for the Nasdaq 100, which fell further, from 58% to 50%, though it improved significantly on Friday. Each index’ shorter-term 20 and 50-day MAs rose as well, as the Dow Jones hit an all-time high, breaking 50,000 for the first time.
The “Risk-On” sentiment fluctuated throughout the week, with the volatility in the U.S. Dollar and the metals industry. 10-year bond yields remained steady, again closing the week basically unchanged, at 4.21%, vs last week’s close of 4.24%, continuing to suggest the bond market is not quite convinced that the economy is in good shape. As noted for several weeks, yields on long-term bonds are likely to stay elevated until that sentiment changes.
The 7 internal factors used to formulate this gauge are listed on the screen (below):
Market Momentum – (S&P 500 vs its 125-day moving avg) = FEAR
Market Volatility (measured by the VIX) = NEUTRAL
Put to Call Ratio 5-day avg. (# of Puts (bearish) vs Calls (bullish) = EXTREME FEAR
Stock Price Strength (# of new 52-week highs vs new 52-week lows) = GREED
Stock Price Breadth (# of shares rising vs falling on NYSE) = GREED
Safe-Haven Demand (which measures stocks vs bonds) = EXTREME FEAR
Junk Bond Demand (non-govt. bond yield spread) = NEUTRAL
This week only 3 of these 7 factors changed levels, led by Safe-Haven Demand, which changed from Greed to Extreme Fear, after the historical drop and shady actions regarding the metals industry. Stock Price Strength also dipped slightly, from Extreme Greed to Greed, as the number of stocks hitting lows increased.
The VIX, measured by Market Volatility, rose 0.7 points, closing the week at 17.7, compared to last week’s close at 17. The crucial “20” level was pierced for the second time in three weeks, closing at 21.7 on Thursday, only to fall back again on Friday. Look for a continued rise in volatility going forward, as February is one of the seasonally weakest months of the year for equities over the past few decades. The chip sector does have strength historically around the middle of the month, so look for potential entry points.
News this week focused on the commodities drama and rising Consumer Sentiment, which hit a 6-month high on Friday. Mixed earnings also caused volatility throughout the week.
As we also discussed the past few weeks, we have now officially entered the 2nd year of the Presidential Cycle, known as the Mid-Term Year, which has historically posted the worst returns of the 4-year cycle, at least leading up to the elections. Please see our Did You Know – About the Mid-Term Election Year blog, dated 12-27-25 for more details.
Astrologically, we continue in Aquarius season (January 19 – Feb 18), ruled by the planet Saturn, which is the 11th sign of the zodiac, with financial implications. Please see our recent Sign Language – Aquarius blog, dated 1-6-26 for full details. Though the Saturn challenging energies of Capricorn continue (as Saturn also rules that sign), the collective symbolism of Aquarius has continued to be reflected in the broadening market (more stocks rising vs falling).
The planet Mercury entered the sign of Pisces on Friday, February 6, 2025, where it will remain until April 14, an unusually long time for one sign, due to its upcoming retrograde in a few weeks (February 26 - March 20). Miscommunication, false reports, and uncertainty on a global basis are back in play, and the retrograde will extend these energies. Be cautious with new investments through this period, and keep on mind that the Communication Services sector will likely remain weak.
The planet Venus will end its transit the sign of Aquarius on Tuesday, Feb 10, and will enter Pisces through March 6, symbolizing dreams and irrational exuberance. Don’t fall in love with an investment, and beware false information. Its upcoming square aspect with Uranus, on February 27, also signifies sudden impulsive financial events.
The planet Mars remains in the sign of Aquarius (Jan 23 - March 2), leaving behind the Capricorn challenging energies that had slowed Mars down (please see our Trader Transits - Mars square Saturn blog, dated 11-29-25).
Please also note that all 3 of these planets have now completed conjunctions with the planet Pluto throughout the latter stages of January (between the 19th and 27th), which is discussed in the same Sign Language – Aquarius blog, signifying more financial and political chaos across the globe.
The planet Jupiter remains in retrograde in the sign of Cancer (until March 11), and as previously discussed, Jupiter has very powerful expansive energies, which may weaken a bit for the time being.
Finally, the planet Uranus ended its 6-month retrograde, turning “direct” on Wednesday February 4, but remains in the sign of Taurus (money) until late April. Right on cue, the equities markets experienced wild swings on Wednesday (the 4th), in both directions, indicative of the Uranus energies, followed by the massive rally on Friday, making it very difficult to swing trade for the inexperienced. Uranus returns to Gemini on April 25, where it will remain until May of 2033.
Leading sectors, with over 50% of stocks trading over their 200-day MAs, continues to include Industrials, Basic Materials, and Energy, while the laggards, Real Estate and Communicative Services (which basically led all of 2025), have diverged, with Real Estate continuing to improve, and Comm Services dropping. With steady interest rates (and expectations of future cuts), high dividend paying Real Estate Investment Trusts (REITS) are becoming popular once again. Sectors of the technology industry that are likely to continue their advance into the future include AI, robotics, quantum computing, and space development (with Pluto positioned in Aquarius, and Uranus in Gemini for many years to come – when it returns in April), though they will experience pullbacks along the way.
Gold (ruled by the Sun), and Silver (ruled by the Moon), showed recovery from last weekend’s debacle early in the week, plunged again on Thursday, and pared those losses with a strong Friday. The recent decline last weekend was not normal (as silver dropped 30%!), for many reasons, though we noted in the past few weeks the surge was unsustainable. The Gold to Silver Ratio (covered in our publication) rose about 6 points, closing at 63.8 compared to last week’s close of 57.3. Silver had been outpacing gold, though has been slowly evening off, lessening the imbalance. Both remain good buys after pullbacks as economic conditions remain the same, with central banks continuing to buy, and Safe-Haven investments expected to remain popular, despite this week’s drop in that category. Bitcoin (ruled by Uranus) struggled through the Uranus retrograde, but could experience a sharp upswing as the planet has turned direct in Taurus (money).
***As always, this information is not intended to be financial advice, or any specific buy or sell recommendation, but rather a guide to assist the reader in some further understanding of current economic conditions/movements in the sky, and how they can affect moods, behaviors, world events, and financial markets.