FEAR & GREED INDEX 19
Weekly Update
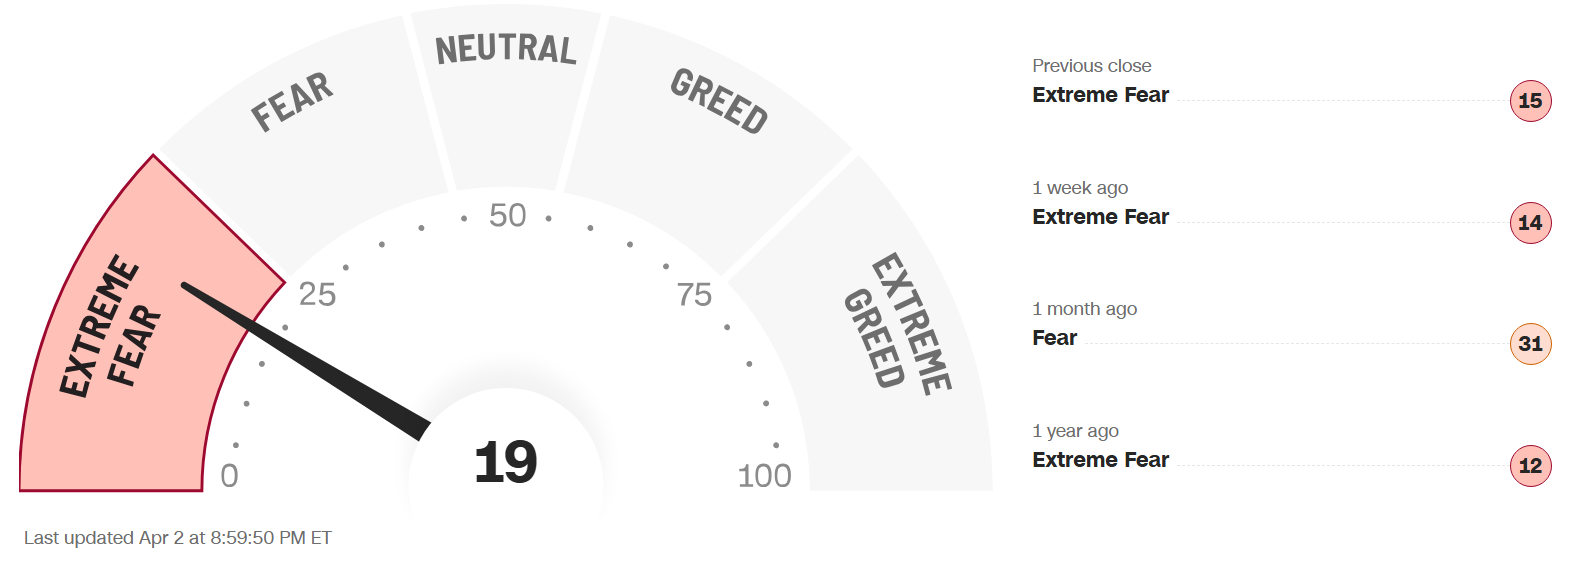
The Fear & Greed Index (found on cnn.com) is one of the easiest indicators to use to determine current market emotion. This simple to read gauge, highlighted in our publication When to Buy and When to Sell: Combining Easy Indicators, Charts, and Financial Astrology (available on Amazon), is measured in a range from 0-100, and currently reads 19 as of the close on Thursday, April 2, 2026, as markets are closed on Friday, April 3.
This figure remains in the Extreme Fear level this week, though it rose 9 points from last week’s close of 10. This was reflected in the S&P 500, which rose 212 points, from 6,368 to 6,580, as the global conflict and energy prices continue to be the main catalyst. As is the theme of this gauge (and discussed in the past few weeks), the further it drops, the more likely a bounce in equities becomes. Though there is no official time frame to expect for reversal, historically markets rise out of this level within a couple of weeks. A strong bounce occurred on Tuesday and Wednesday this week, on hopes of an end, or significant ease, to the global military conflict, which we noted could easily push stocks higher. The sentiment tempered a bit on Thursday, however, with oil prices again on the rise, as daily announcements continue to fluctuate equity markets.
The 4 major indexes’ 200-day MAs (Moving Averages) internal sentiment remains bearish, though much improved this week, as they all remain below 50%. The shorter-term 20 and 50-day MAs all saw a boost this week due to the rally, and are currently neutral around the 50% level.
The “Risk-On” sentiment returned this week, at least for the time being, as technology stocks led the 2-day surge, though geopolitical tensions, higher mortgage rates, and rising inflation figures continued to be a factor. 10-year bond yields eased a bit, ending the week at 4.31%, vs last week’s close of 4.43%, as did The Mannarino Risk Indicator (noted in our monthly Indicator Insights blog, and our publication) which dropped slightly from 276 to 268. Stagflation, when the economy is slowing and inflation is rising, has also become a concern as well. The growing belief that the interest rate policy will remain unchanged for the foreseeable future is also limiting market gains.
The 7 internal factors used to formulate this gauge are listed on the screen (below):
Market Momentum – (S&P 500 vs its 125-day moving avg) = EXTREME FEAR
Market Volatility (measured by the VIX) = NEUTRAL
Put to Call Ratio 5-day avg. (# of Puts (bearish) vs Calls (bullish) = EXTREME FEAR
Stock Price Strength (# of new 52-week highs vs new 52-week lows) = EXTREME FEAR
Stock Price Breadth (# of shares rising vs falling on NYSE) = EXTREME FEAR
Safe-Haven Demand (which measures stocks vs bonds) = FEAR
Junk Bond Demand (non-govt. bond yield spread) = EXTREME FEAR
This week, 2 of these 7 factors changed levels, as almost all remain in Extreme Fear categories. The VIX came down just enough to be considered Neutral, and Safe-Haven investments improved slightly. Otherwise, these factors remain at low levels, reflecting the uneasiness that remains in current conditions.
The VIX, measured by Market Volatility, decreased this week, closing 7.2 points (23%) lower at 23.8, compared to last week’s close of 31. The gauge has now remained above the crucial “20” danger-zone level for 24 straight trading days, and likely needs to move below that mark to realize any sustainable rally. The month of April, seasonally, tends to remain volatile in the early stages, and generally calms by the end. In 2025, the markets bottomed around April 8, due to tariff uncertainty, and current conditions imply these figures are dependent on the global conflict coming to an end.
The geopolitical conflict in the Middle East, and energy prices, remain in focus, as the market continues to be news driven over recent weeks. As the uncertainty persists, and the VIX remains over 20, markets are likely to continue their struggle. Economic data was mixed again this week, with manufacturing and retails sales down, but both consumer and CEO sentiment improving. A surprisingly strong jobs report on Friday (when markets were closed) further solidifies the “no rate cut” outlook. Do not forget (as mentioned in the past several weeks in this blog), we are in 2nd year of the Presidential Cycle, which has historically posted the worst returns of the 4-year cycle (please review our Did You Know – About the Mid-Term Election Year blog, dated 12-27-25).
Astrologically, we continue through Aries season, the 1st sign of the zodiac, ruled by Mars (Mar 21 – Apr 19). Please see our recent Sign Language – Aries blog, dated 3-6-26 for full details. Aries’ fiery, aggressive, act-first, think-later energies, which require more emotional control than usual, have been reflected with many strong starts to trading days that fade out by the close.
The planet Mercury’s transit through in the sign of Pisces will end on April 14, when it will also enter the sign of Aries. Communications may become more aggressive, regardless whether they have any basis, which again suggests some false rallies based on news items.
The planet Venus has now entered the sign of Taurus (Mar 30 – Apr 24), moving from the full-speed ahead approach (Aries) to a much more grounded and logical Earth sign (Taurus). Venus’ is at “home” in one of its two “ruling” signs (Libra is the other) and is usually very favorable for Bitcoin. Although Venus in Taurus sees gains historically, it forms a square aspect with Pluto this weekend, so be cautious with trusting any rally this coming week. Please see our Trader Transits – Venus in Taurus blog, dated 3-26-26, for more details.
As the planet Mars approaches the sign of Aries (its ruling sign with Scorpio), entering this Thursday, April 9, the aggressive energies ramp up again. Mars formed a square with the planet Uranus a few weeks ago, resulting in a sudden plunge in the technology sector, and will now form a square with Pluto (in Aquarius), so watch for more fireworks in that sector. Mars’ overzealous energies can be dangerous in an uncertain market, so again, be sure not to FOMO into any speculative stocks for the time being.
As the planet Uranus (sudden events) approaches its final days in the sign of Taurus (money), until April 25th, wild price swings are expected to continue, especially in the technology (Uranus) sector. The planet returns to Gemini, ruled by Mercury (considered a lower-level Uranus) a sign of high intelligence, communications, and technology, in about 3 weeks, where it will remain until May of 2033.
Although the recent Saturn-Neptune conjunction (Feb 27), continues to separate, the effect is long-lasting with these slow-moving planets. This conjunction traditionally causes a push and pull between structure and restriction (Saturn) and dreams and ideals (Neptune), which has held true with the market uncertainty. With the Sun, Mercury, and Mars crossing over these planets during Aries season, the likelihood of rallies starting, and stopping, with no clear direction, remains.
Leading sectors continued to include Energy and Utilities, typical in current economic/global conditions, as all others have fallen off the map. Although there was a slight boost mid-week, current laggards including Consumer-related, Healthcare, and Financials remained very low, which is not a positive indication in the short term. These three, however, remain at historical short-term low levels, suggesting a bounce sooner-rather-than-later. Real Estate also remains down, with decreasing sales reports in recent weeks.
Sectors of the technology industry that are likely to continue their advance into the future include AI, robotics, quantum computing, and space development (with Pluto positioned in Aquarius, and Uranus in Gemini for many years to come – when it returns on April 25), though they will experience pullbacks along the way.
Gold (ruled by the Sun), and Silver (ruled by the Moon), were volatile this week, but ended with gains. The Gold to Silver Ratio (covered in our publication) was basically unchanged, ending the week at 64, after last week’s close of 64.4, remaining rather neutral. Both metals remain good buys after pullbacks, so long as economic conditions remain the same, with central banks continuing to buy, and Safe-Haven investments expected to remain popular. Bitcoin (ruled by Uranus) also rose mid-week, then pulled back, as it continues its long consolidation. Uranus (sudden change/technology) now direct in Taurus (money), combined with Venus (money) entering Taurus this week sets the stage for some fireworks, as noted above. Its Fear & Greed Index now reads 29, remaining in Fear territory, after last week’s close of 25. A few weeks ago, we suggested a possible bounce when the reading was 18, though we remain cautious until a clear uptrend has developed.
***As always, this information is not intended to be financial advice, or any specific buy or sell recommendation, but rather a guide to assist the reader in some further understanding of current economic conditions/movements in the sky, and how they can affect moods, behaviors, world events, and financial markets.