FEAR & GREED INDEX 24
Weekly Update
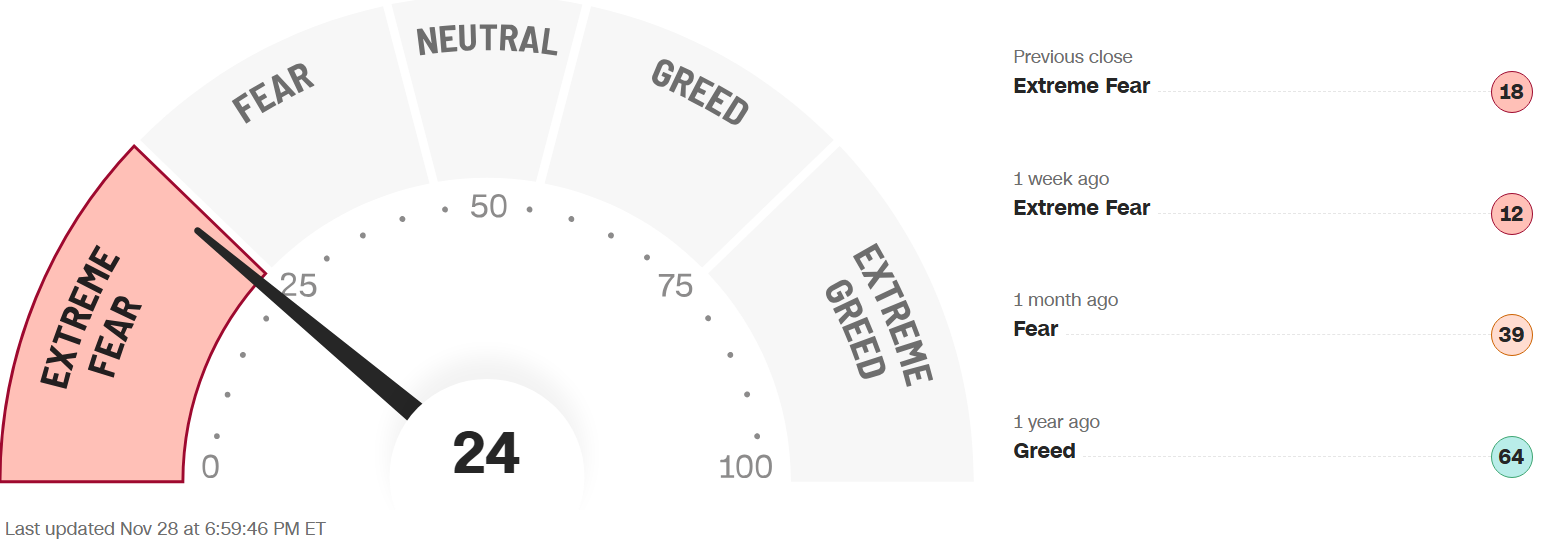
The Fear & Greed Index (found on cnn.com) is one of the easiest indicators to use to determine current market emotion. This simple to read gauge, highlighted in our publication When to Buy and When to Sell: Combining Easy Indicators, Charts, and Financial Astrology (available on Amazon), is measured in a range from 0-100, and currently reads 24 as of the close on Friday, November 28, 2025.
This figure remains at the upper edge of the Extreme Fear level, after rising 13 points from last week’s close of 11, in a holiday-shortened week on Wall Street. This was reflected in the S&P 500, as it gained a whopping 247 points, from 6,602 to 6,849, after a major reversal upward since last Friday. As expected, the markets rallied after the extremely low reading the past two weeks. Though there is never a set time frame or guarantee for a bounce, this rally fell in line with the theory of this gauge.
The 4 major indexes (S&P 500, Nasdaq, Dow Jones Industrial, and Russell 2000), have resumed their internal bullish 200-day moving averages, with all now comfortably over 50%, and 3 of the 4 over 60% (S&P 500 at 54%). Each index’ shorter-term 20 and 50-day MAs skyrocketed this week, and are also now over 50%, with the Nasdaq 100 as the only exception (47%). The first 3 weeks of November (the most favorable month for equities over the past few decades), had been unusually negative, after uncommon gains in September and October, before the sudden turnaround, leading into December, a month where fund managers alter their portfolios to buy leading stocks.
The “Risk-On” sentiment returned this week, as the expectation of an interest rate cut in early December returned, the VIX dropped, and 10-year bond yields continuing to fall, closing the week at 4.02% vs last week’s close of 4.07%.
The 7 internal factors used to formulate this gauge are listed on the screen (below):
Market Momentum – (S&P 500 vs its 125-day moving avg) = FEAR
Market Volatility (measured by the VIX) = NEUTRAL
Put to Call Ratio 5-day avg. (# of Puts (bearish) vs Calls (bullish) = EXTREME FEAR
Stock Price Strength (# of new 52-week highs vs new 52-week lows) = EXTREME FEAR
Stock Price Breadth (# of shares rising vs falling on NYSE) = EXTREME FEAR
Safe-Haven Demand (which measures stocks vs bonds) = EXTREME FEAR
Junk Bond Demand (non-govt. bond yield spread) = EXTREME FEAR
This week 2 of these 7 factors changed levels, as (not surprisingly) Market Momentum improved from Extreme Fear to Fear. However, all others, except the VIX, remain in Extreme Fear, as they had fallen so far that they haven’t quite moved up enough to change levels.
The VIX, measured by Market Volatility, was the only other metric to rise, closing the week at 16.5, vs. last week’s close of 23.4, a significant drop as the markets calmed and positive sentiment returned. The crucial “20” level, was sustained for several trading days, before the sudden bullish reversal.
News this week included a report on Monday that Meta was considering spending a vast amount of money on Alphabet (Google) AI chips, which could significantly impact tech giant NVIDIA. Despite Nvidia’s recent blowout earnings results, with very positive forward guidance, the stock slumped on Tuesday, and did not recover all week.
Earnings overall have been mainly positive, with 3rd quarter growth of over 14% (when it was estimated around 7.2%), though record high layoffs continue to weigh on the economy. Federal data, which had been delayed due to the government shutdown, started to release some reports, though many were old figures from September. Mixed reports and no real negative news helped temper the market volatility.
Astrologically, Sagittarius season (ruled by the planet Jupiter) continues through December 21. Please see our recent Sign Language – Sagittarius blog, dated 11-4-25 for full details. The Scorpio/Mars energies of Scorpio season have been replaced by the Sagittarius/Jupiter optimism and expansion, which usually results in favorable market conditions.
The planets Mercury and Saturn both completed their retrograde periods yesterday, November 29. Both planets weakening backwards motion suggested an easing in the selling pressure over the past few days. As we warned, Mercury Retrograde historically results in a market pullback, or at least added volatility, which was clearly the case once again.
The planet Venus also enters the sign of Sagittarius today, remaining until Dec 23, and was conjunct with retrograde Mercury a few days ago on Monday, Nov 25, the start of the bullish reversal this week. Venus’ energies are much more favorable in Sagittarius, signifying more peace and harmony in financial arenas.
The planet Mars also continues to transit the sign of Sagittarius (until Dec 14), theoretically reducing aggression and volatility. As previously noted, Mars’ energies were very strong as it passed through its “home” sign of Scorpio, which resulted in divergent markets, despite all-time highs. Mars in Sagittarius combined with the Mercury Retrograde continued the unsettled emotions and market fear.
The planet Jupiter also turned retrograde (in the sign of Cancer) on Tuesday, November 11 (continuing until March 11). As previously discussed, Jupiter has very powerful expansive energies, which may weaken a bit for the time being.
Finally, the planet Uranus, which is currently in retrograde until early February, regressed from the sign of Gemini to the sign of Taurus (money), on Thursday, November 7, and will not return to Gemini until April, 2026. This 6-month re-visit to the sign of money (ruled by Venus), could create more shocks to the markets, in either direction, so beware. Please review our Planet Power – Uranus Retrograde blog, dated 8-27-25 for further details.
Leading sectors, with over 50% of stocks trading over their 200-MAs, continued to be led by Utilities, Healthcare, and Energy, though basically all sectors, including long-time laggard Real Estate, saw significant short-term gains. In the long run, sectors of the technology industry that are likely to continue their advance into the future include AI, robotics, quantum computing, and space development (with Pluto positioned in Aquarius, and Uranus in Gemini for many years to come – when it returns in April), but will experience pullbacks along the way.
Gold (ruled by the Sun), and Silver (ruled by the Moon), surged again this despite the “risk-on” return, suggesting equities investors remain somewhat nervous. The Gold to Silver Ratio (covered in our publication), declined this week, closing at a yearly low of 74.7, compared to last week’s close of 81.2, as silver has gained faster than gold. Both remain good buys after pullbacks in the current economic conditions, as central banks continue to buy. Bitcoin (ruled by Uranus) reversed upward a bit this week, after a large down move, in lock-step with the Uranus retrograde back into Taurus.
***As always, this information is not intended to be financial advice, or any specific buy or sell recommendation, but rather a guide to assist the reader in some further understanding of current economic conditions/movements in the sky, and how they can affect moods, behaviors, world events, and financial markets.