FEAR & GREED INDEX 25
Weekly Update
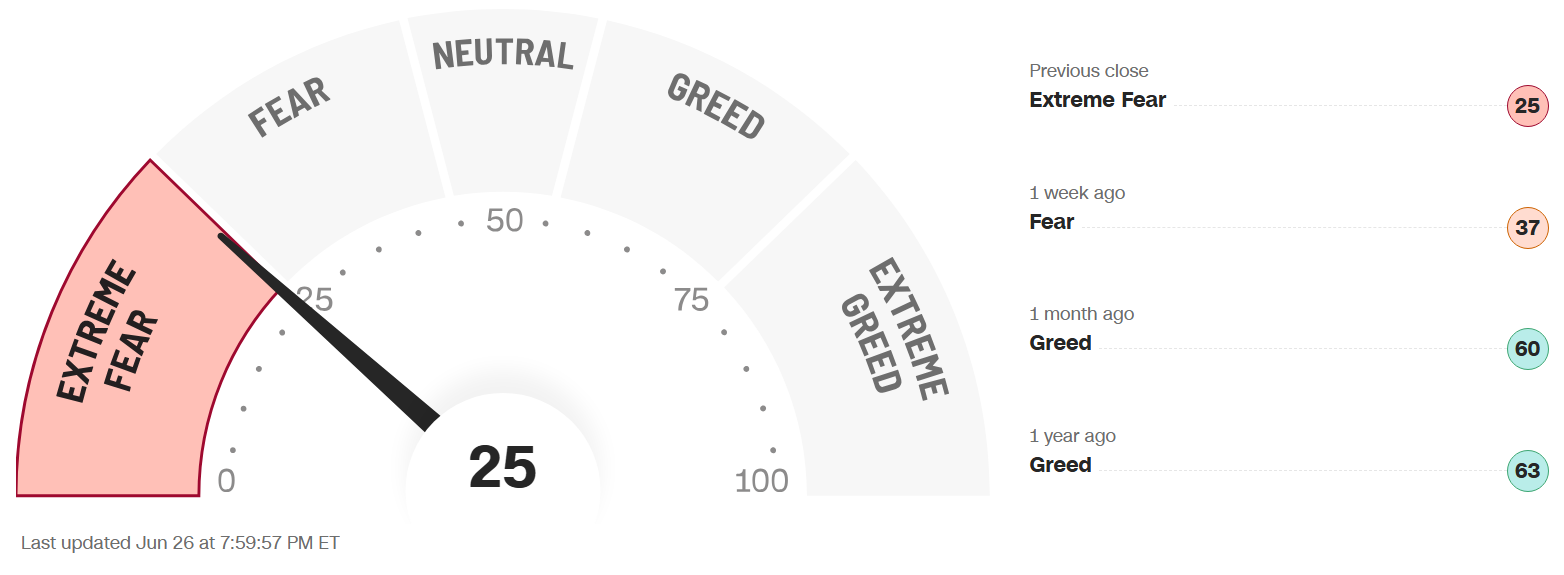
The Fear & Greed Index (found on cnn.com) is one of the easiest indicators to use to determine current market emotion. This simple to read gauge, highlighted in our publication When to Buy and When to Sell: Combining Easy Indicators, Charts, and Financial Astrology (available on Amazon), is measured in a range from 0-100, and currently reads 25 as of the close on Friday, June 26, 2026.
The gauge slid significantly to the edge of the Fear/Extreme Fear line, falling 12 points from last week’s close of 37. This was reflected in the S&P 500, which fell 146 points, from 7,500 to 7,354, in a negative week for equity markets. Note that levels are getting close to a reversal indication in the short-term.
The 4 major indexes’ 200-day MAs (Moving Averages) internal sentiment, however, did not decline, as it remained steadily in the bullish zone. The main reason was, despite losses in the technology sector, there was a rotation to other sectors, not a selloff to cash, which is positive for the markets. The number of stocks making new highs on all indexes remains around 58%, now led by the Russell Small Cap at 66% (see our Financial Focus - Russel Re-Alignment blog, dated 6-1-26 for more details). The shorter-term 20 and 50-day MAs firmed up on all but the leading technology stocks, as many have fallen below the 50% mark, again a result of the sector rotation.
The “Risk-On” sentiment declined again this week, after last week’s Federal Reserve’s new Chairman’s “hawkish” comments regarding likely rate hikes in the future. 10-yr bond yields decreased slightly, to 4.38%, down from last week’s close of 4.46%, as interest rate policy uncertainty continues. Stagflation, when the economy is slowing and inflation is rising, continues to be a concern, as a rise in interest rates may be on the table. Quarterly Window Dressing, in addition to the Russell Re-Alignment, which we discussed recently (and is explained in our publication), could be on the table for a Monday and Tuesday bounce.
The 7 internal factors used to formulate this gauge are listed on the screen (below):
Market Momentum – (S&P 500 vs its 125-day moving avg) = FEAR
Market Volatility (measured by the VIX) = NEUTRAL
Put to Call Ratio 5-day avg. (# of Puts (bearish) vs Calls (bullish) = EXTREME FEAR
Stock Price Strength (# of new 52-week highs vs new 52-week lows) = FEAR
Stock Price Breadth (# of shares rising vs falling on NYSE) = EXTREME FEAR
Safe-Haven Demand (which measures stocks vs bonds) = EXTREME FEAR
Junk Bond Demand (non-govt. bond yieldspread) = EXTREME FEAR
This week, 3 of these 7 factors changed levels, as Market Momentum joined Stock Price Strength/Breadth in Fear levels. The all-important Put to Call Ratio (used more by short-term traders) also slipped back to the Fear level in a topsy-turvy market.
The VIX, measured by Market Volatility, oscillated during the week, ending 2 points higher at 18.4, vs last weeks close of 16.4, as uncertainty crept back into equities. As we often note, any break-through of the crucial “20” mark suggests a pullback, which it almost reached on Tuesday, before retreating a bit.
Energy prices continued to decline this with positive investor sentiment regarding an end, or at least better conditions, regarding the global military conflict, though this can change on a dime.
Economic data was mixed again this week, with solid employment, personal income/spending, and consumer sentiment (though still very low Year-over-Year). This helps raise Consumer Discretionary stocks (as mentioned last week) should the trend continue. Another Inflation scare on Thursday, however, initially spooked the markets and technology stocks, despite extremely positive earnings results from chip maker Micron (MU).
Astrologically, we have moved into Cancer season (June 21 – July 21). Gemini season produced the expected volatility, but no significant price move (typical of this season), as the S&P 500 gained less than 1%. Cancer, a water sign, is known for its protective, emotional energies, as well as favorable equities market returns. This may be tempered this year, however, with the next Mercury Retrograde beginning tomorrow, Monday, June 29, and Jupiter’s departure from the sign on Tuesday, June 30. Please review our Sign Language – Cancer blog, dated 6-8-26 for more details.
Mercury, the planet of trading, is currently transiting the sign of Cancer (remaining for over 2 months until Aug 9), signifying a shift in mood and sentiment. This transit is longer than usual for Mercury, highlighted by the three-week retrograde period, which is often problematic for markets, as it has a history of signifying restricted gains, reversals, and/or pullbacks. Traders may want to keep position sizes smaller, and use some intuition during this period. If it doesn’t “feel” right, avoid it for now, and keep stops mental, not in the system.
The planet Venus, transiting the sign of Leo through July 9, highlights fashion and self-pleasing products, signified by the Consumer Discretionary sector. Stocks in that sector had been beaten down over the past several months, but has shown improvement (as expected), which would continue along with rising consumer sentiment.
The planet Mars now enters the sign of Gemini today, June 28, a more comfortable sign after leaving Taurus, a slow-moving, earth sign. Mars picks up the pace again in this air sign, but be conscious to avoid being too impulsive. Mars is also approaching a conjunction with the planet Uranus on July 4, which could provide more fireworks (pun intended) in the markets. Please review our recent Trader Transits – Mars conjunct Uranus blog, dated June 22, for further details.
Jupiter will also change signs, from Cancer to Leo on Tuesday, signifying a shift in sector sentiment, discussed in our recent Trader Transits – Jupiter in Leo blog, dated 6-12-26, and yesterday’s Sector Search – Quarterly Preview blog. Gold, travel, consumer discretionary, and arts and entertainment stocks have already begun to advance, while Real Estate continues to be solid with Cancer influence. This transit also has an attached connotation of market decline, so be cautious.
As discussed heavily in recent months, Uranus (sudden, unexpected events/high technology) transits the sign of Gemini (communications, transportation) until 2033. Gemini, like Uranus, also represents high intelligence, communications, and technology, signifying major advances in those industries. Uranus’ energies have been on full display of late, with quick, unexpected reversals, and do not be “surprised” if this type of market action continues with Mars approaching Uranus. As earlier noted, the two will form a conjunction next weekend, on the 4th of July, suggesting high volatility just prior to, and after, that weekend date. Please also review our Trader Transits – Uranus in Gemini blog, dated 3-30-26, for more details.
Leading sectors have changed for the time being, as we noted with the “Sector Rotation.” Energy nosedived this week with oil’s drop, based on the perception of the status of the military conflict. Financials, which is always important for a bullish market, reversed this week, and both Healthcare and Real Estate were strong. The “rotation” is better for the market than liquidating to cash or turning to bonds in a “flight-to-quality.”
As we continued to stress, sectors of the technology industry that are likely to continue their advance into the future include AI, robotics, quantum computing, and space development (recent surge), with both Pluto positioned in Aquarius and Uranus in Gemini, for many years to come, though they will experience pullbacks along the way.
Gold (ruled by the Sun), and Silver (ruled by the Moon), declined significantly this week, before recovering somewhat the last two days, with interest rate uncertainty, and strength in the U.S. Dollar. The Gold to Silver Ratio closed at 69.1, an increase of 5 points from last week’s close of 64.1, remaining rather neutral, but moving toward a silver bias. As we continue to stress, both metals remain good buys after pullbacks, so long as central banks continue to buy, and Safe-Haven investments remain popular, which is expected. Bitcoin (ruled by Uranus) continues to struggle, with its Fear & Greed Index closing at 16, vs last week’s close of 20, remaining in ExtremeFear territory. Look for some improvement in the beaten down sector as levels may have reached a buying opportunity.
***As always, this information is not intended to be financial advice, or any specific buy or sell recommendation, but rather a guide to assist the reader in some further understanding of current economic conditions/movements in the sky, and how they can affect moods, behaviors, world events, and financial markets.