Weekly Update
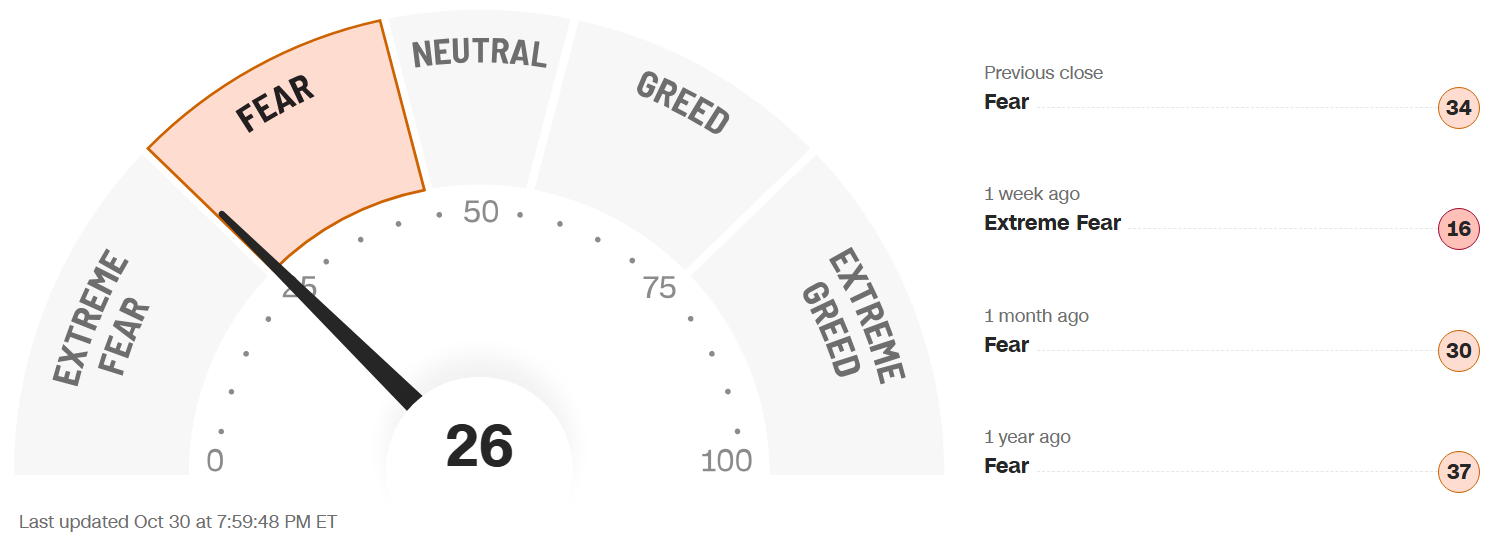
The Fear & Greed Index (found on cnn.com) is one of the easiest indicators to use to determine current market emotion. This simple to read gauge, highlighted in our publication When to Buy and When to Sell: Combining Easy Indicators, Charts, and Financial Astrology (available on Amazon), is measured in a range from 0-100, and currently reads 26 as of the close on Friday, October 30, 2026.
The gauge edged up closer to the Fear category during the week, and remains at the border of Extreme Fear after a market sell off at the end of the week, rising 5 points from last week’s close of 21. The S&P 500 dropped 43 points, from 7,623 to 7,580, mainly due to the massive 140-point drop on Friday. Remember, this level of fear often suggests a rally in the near future, which started and stalled again this week after weak earnings and outlooks from major companies including Google, Amazon, and Intel, among others.
The 7 internal factors used to formulate this gauge are listed on the screen (below):
Market Momentum – (S&P 500 vs its 125-day moving avg) = EXTREME FEAR
Stock Price Strength (# of new 52-week highs vs new 52-week lows) = FEAR
Stock Price Breadth (# of shares rising vs falling on NYSE) = FEAR
Market Volatility (measured by the VIX) = FEAR
Put to Call Ratio 5-day avg. (# of Puts (bearish) vs Calls (bullish) = FEAR
Safe-Haven Demand (which measures stocks vs bonds) = EXTREME FEAR
Junk Bond Demand (non-govt. bond yield spread) = FEAR
This week, 3 of these 7 factors changed levels, though overall momentum remained at Fear levels. For weeks we have expressed the fragile underlying structure of the markets, which were improving this week prior to those earnings announcements.
Overall market internals Moving Averages’ (MAs) sentiment has been quietly showing some improvement, with a broader scope of stocks gaining vs losing, as is evident by the Equal Weighted SPY’s (RSP) steady uptrend. The longer-term 200-days remain bearish, but have improved to 45%, vs last week’s close of 44%, with the DJIA still leading at 63%, (vs 70% last week). The shorter-term MAs now read 41% on the 50-day (vs 48% last week), and 52% on the 20-day (vs 49% last week), even after the end of the week decline. The only major index remaining below 50% is the interest rate sensitive Russell 2000 small-cap, though it improved to 48%. Sector strength remained fragmented this week, as speculative stocks, which are interest-rate sensitive, remained low. Defensive sectors including Healthcare, Energy, and Utilities remain strong in the short-term, while Real Estate/Consumer and Communications continue to struggle. Earnings season is now in full gear, reporting mixed results thus far, and the weak have, and will certainly continue to be punished in this environment.
The “Risk-On” sentiment was also improving prior to the weak earnings reports, as oil and interest rates showed slight improvement, though inflation numbers remained elevated. 10-yr bond yields did decline slightly, due to continued Flight-to-Quality moves into bonds (at least for the time being), ending the week lower by 0.7 points, at 4.93% vs last week’s close of 5%. The Mannarino Risk Index declined 4 points to 312, vs last week’s 316, but remains in the mid-Extreme Risk level (max is 350), as it has closed over 300 for the 8th straight week. With the Mid-term Elections two days away, conditions are expected to improve after the dust settles.
The VIX (market volatility), dipped in the first half the week, though it finished flat at 19.4, after rising to over 21 on Friday. As we often note, any break-through of the crucial “20” mark suggests a pullback, which was the case on Friday.
Economic reports this week focused on the noted earnings, the U.S. GDP, and the PCE inflation report, which was higher than expected Year-over-Year.
Astrologically, we continue through Scorpio season (Oct 23 – Nov 21), signifying sharper, Mars led aggressive energies, signifying stronger rallies, or drops, in equity price action, which was the case again this week. Major uncertainty and nervousness persist in market conditions, which caused the expected spike in volatility. Please review our Sign Language – Scorpio blog, dated 10-8-26 for more details.
As discussed in recent weeks, current shorter-term transits/aspects of note include the ongoing Venus Retrograde (Oct 3 – Nov 14), whose energies finally kicked in last week, and the Mercury Retrograde beginning this weekend (Oct 24 – Nov 15), which are both traditionally negative for the markets. Both retrogrades will last through the Mid-Term Elections, another historical volatile time frame, during which tighter stop-losses and lower share sizes are suggested. The Mercury Retrograde reared its ugly head just a few days in as its energies were again accompanied with price reversals. Mercury (known as the “Messenger” and the “Trickster”) turned an early Halloween week “treat” into a nasty “trick.” Please review our Did You Know – About the Mid-Term Elections blog, dated 9-23-26, for more details.
Longer-term, the planet Jupiter remains in the sign of Leo until July 26, 2027, highlighting fashion, self-pleasing products, creativity, and travel (signified by the Consumer Discretionary sector), as well as leadership, defense, and gold (Please refer to our Trader Transits – Jupiter in Leo blog, dated 6-12-26, for further information). Consumer Discretionary stocks, that usually rally in the holiday shopping period, have stalled with recent low Consumer Sentiment and Confidence readings, as well as rising interest rates. Keep in mind that travel-related stocks have slumped due to their sensitivity to oil prices, which are vulnerable to the military conflict status (or “perceived” status).
Also, as discussed heavily in recent months, Uranus (sudden, unexpected events/high technology) will remain in the sign of Gemini (communications, transportation, advanced technology) until 2033. Uranus’ energies have continued since the end of May, when Uranus entered the sign, with unexpected reversals in both directions (especially with technology), as the market remains choppy and cannot seem to make up its mind (Gemini). Please also review our Trader Transits – Uranus in Gemini blog, dated 3-30-26.
As we have noted for over 1 year now, sectors of the technology industry that are likely to continue their advance into the future include AI, robotics, quantum computing, and space development, with Pluto positioned in Aquarius, and Uranus in Gemini, for many years to come, though they will experience pullbacks (sometimes sizeable) along the way.
Gold (ruled by the Sun), and Silver (ruled by the Moon), were steady this week, until a plunge on Friday, hitting 3-month lows again, as the U.S. Dollar remains strong with higher interest rates. The Gold to Silver Ratio rose to 78.9, up 4.8 points from last week’s close of 74.1, again reaching its highest reading in 10 months. The level remains rather neutral, though would be favoring silver if it continues to rise. We have stressed over the past several months that both metals remained good buys after pullbacks, so long as central banks continue to buy and Safe-Haven investments remain popular. Central banks have recently been a bit erratic with their purchases, however, as rising bond yields have made that investment more popular in the short-term.
Finally, Bitcoin (ruled by Uranus), continues to trend lower, and its Fear & Greed Index has dropped to the Fear level, ending the week 11 points lower, at 35, after closing last week at 46. No current catalyst is present for crypto, as the recently discussed Clarity Act has stalled in the Senate and still awaits the next step. Please review our Did You Know? – About The Clarity Act blog, dated 7-26-26, for further information.
***As always, this information is not intended to be financial advice, or any specific buy or sell recommendation, but rather a guide to assist the reader in some further understanding of current economic conditions/movements in the sky, and how they can affect moods, behaviors, world events, and financial markets.