FEAR & GREED INDEX 27
Weekly Update
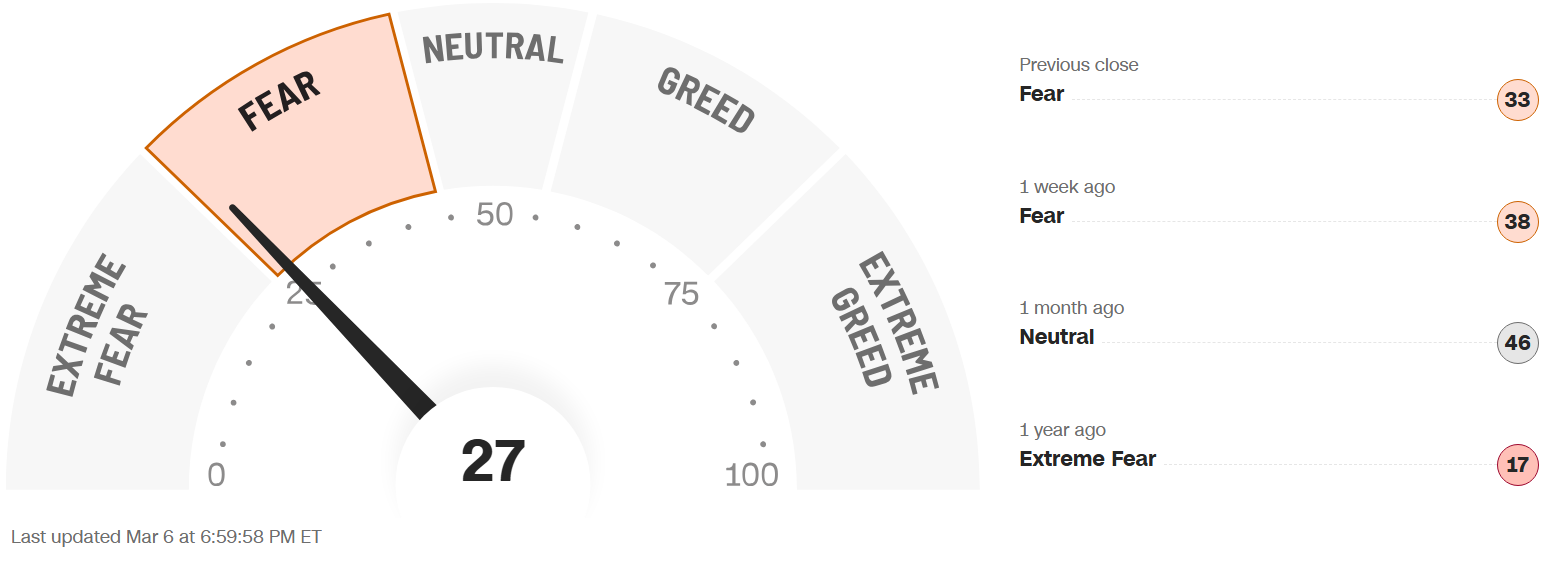
The Fear & Greed Index (found on cnn.com) is one of the easiest indicators to use to determine current market emotion. This simple to read gauge, highlighted in our publication When to Buy and When to Sell: Combining Easy Indicators, Charts, and Financial Astrology (available on Amazon), is measured in a range from 0-100, and currently reads 27 as of the close on Friday, March 6, 2026.
This figure dropped to the lower-Fear level, on the cusp of Extreme Fear, after plunging 16 points, after last week’s close of 43. This was reflected in the S&P 500, which declined about 138 points, from 6,878 to 6,740. Keep in mind that the further this gauge drops, the more likely a bounce in equities becomes.
The 4 major indexes’ 200-day MA (Moving Average) internal bullish sentiment continued to decline as well, as they have dipped into the mid and low 50% range, with the Nasdaq now flirting again with Bear territory around 50%. The shorter-term 20 and 50-day MAs all declined significantly, with most in the 30’s% range, though recent leader Dow only at 27% on the 20-MA, while recent laggard Nasdaq 100 surprisingly ending with the best figure at 47%.
The “Risk-Off” sentiment surprisingly fluctuated this week, as sector rotation replaced “Flight to Quality,” and 10-year bond yields rose rather sharply, ending the week at 4.14%, vs last week’s close of 3.95%.
The 7 internal factors used to formulate this gauge are listed on the screen (below):
Market Momentum – (S&P 500 vs its 125-day moving avg) = EXTREME FEAR
Market Volatility (measured by the VIX) = EXTREME FEAR
Put to Call Ratio 5-day avg. (# of Puts (bearish) vs Calls (bullish) = EXTREME FEAR
Stock Price Strength (# of new 52-week highs vs new 52-week lows) = GREED
Stock Price Breadth (# of shares rising vs falling on NYSE) = GREED
Safe-Haven Demand (which measures stocks vs bonds) = EXTREME FEAR
Junk Bond Demand (non-govt. bond yield spread) = EXTREME FEAR
This week 3 of these 7 factors changed levels, as both Stock Price Strength and Breadth cooled off a bit after recent strength with a broadening market. The VIX spiked significantly this week, rising from Neutral to Extreme Fear, after a very tumultuous week. As recently discussed, the seasonal volatility has returned, and mixed signals continue to keep uncertainty and risk aversion at heightened levels. It should also be noted that the Put to Call Ratio remained at the Extreme Fear level, suggesting that put buying may overdone, which would indicate an upcoming improvement in equities.
The VIX, measured by Market Volatility, remained heightened all week (almost reaching 30), with the global conflict front and center, closing at 29.5, compared to last week’s close of 19.8. The gauge remained above crucial the “20” level as the week progressed, with its highest levels occurring on Thursday and Friday. As we warned over the past several weeks, February is one of the seasonally weakest months of the year for equities over the past few decades, which held true, though it only dropped .08%. March is very wishy-washy, especially the first half of the month, so continue to be guarded with the global conflict and seasonal uncertainty.
News this week mainly focused on the geopolitical conflict in the Middle East, and its daily back-and-forth news announcements. On Friday, employment numbers were very weak, and to no one’s surprise, the December job creation figure was revised downward.
As we also discussed the past few weeks, we have now officially entered the 2nd year of the Presidential Cycle, known as the Mid-Term Year, which has historically posted the worst returns of the 4-year cycle, at least leading up to the elections. Please see our Did You Know – About the Mid-Term Election Year blog, dated 12-27-25, for more details.
Astrologically, we continue through Pisces season (Feb 19 – Mar 20), ruled by Jupiter, which is the 12th sign of the zodiac. Please see our recent Sign Language – Pisces blog, dated 2-6-26 for full details. The challenging Saturn energies of Capricorn and Aquarius have now been replaced by the energies of Jupiter (expansive) and co-ruler Neptune (imaginative, secretive), which continues the uncertainty theme in the equities markets. We also experienced an emotional (Moon) Lunar Eclipse on Tuesday the 3rd, combined with Mercury Retrograde, all in Pisces, resulting in a major breakdown of indexes at the open, followed by a short-lived recovery (please also refer to our Planet Power - Eclipses blog, dated 8-21-25, for further information).
The planet Mercury remains in the sign of Pisces (Feb 6 – Apr 14), and began its current retrograde period on Thursday (Feb 26). Miscommunication, false reports, and uncertainty on a global basis are back in play, and the retrograde extends these energies through March 20. Be cautious with new investments through this period, and keep in mind that the Communication Services sector will likely remain weak.
The planet Venus has entered the sign of Aries this weekend (Mar 6 – Mar 30), transferring from more peaceful, passive energies (Pisces) to an aggressive, full-speed ahead approach (Aries). Don’t fall in love with an investment, and continue to be aware of false information and/or break-outs. This planet is conjunct both Neptune (yesterday, March 7) and Saturn (today, March 8), just as the planet enters Aries, so be ready for more potential fireworks tomorrow (Monday the 9th), as the Mars (ruler of Aries) aggression kicks in.
The planet Mars also entered Pisces earlier this week (Mar 2 – Apr 9), leaving behind the Aquarius challenging energies that had slowed Mars down (please see our Trader Transits - Mars square Saturn blog, dated 11-29-25). Mars formed a square with the planet Uranus at the end of last week, resulting in another sudden plunge in the technology sector. Mars’ overzealous energies can be dangerous in an uncertain market, so be sure not to FOMO into any speculative stocks for the time being.
The planet Jupiter’s finally ends its retrograde in the sign of Cancer this coming Wednesday, March 11. As previously discussed, Jupiter has very powerful expansive energies, which had been weakened over the past few months, but may ramp up again with the planet returning to prominence in March.
The planet Uranus remains in the sign of Taurus (money) until late April, after finally ending its 6-month retrograde on February 4. Right on cue, the equities markets experienced wild swings on Wednesday (the 4th), in both directions, indicative of the Uranus energies, which have continued throughout the month. This planet also formed a square aspect to the Sun on Tuesday (Feb 17), resulting in a very strong start, which then petered out by days end. As noted above, it then squared Mars on Friday Feb 27, which again ended in a strong downturn in technology stocks. Uranus returns to Gemini on April 25, where it will remain until May of 2033.
Finally, the long-awaited Saturn-Neptune conjunction arrived last Friday, the same day the Supreme Court (Saturn) made their decision regarding tariffs (Neptune). This conjunction traditionally causes a pull and push between structure and restriction (Saturn) and dreams and ideals (Neptune), which results in uncertainty. What happens next remains to be seen, and caution should be heeded as markets gyrate with no clear direction.
Leading sectors, with over 50% of stocks trading over their 200-day MAs, continues to include Energy, Utilities, and Basic Materials/Industrials, (safer, more defensive industries), though Consumer Staples dropped with weak retail reports. Current laggards, Real Estate and Financials remained very low, which is not a positive indication in the short term. Sectors of the technology industry that are likely to continue their advance into the future include AI, robotics, quantum computing, and space development (with Pluto positioned in Aquarius, and Uranus in Gemini for many years to come – when it returns in April), though they will experience pullbacks along the way.
Gold (ruled by the Sun), and Silver (ruled by the Moon), both declined this week after recent run-ups. The Gold to Silver Ratio (covered in our publication) rose, ending the week at 61.2, after last week’s close of 56.3, slightly favoring gold as a better “value.” Both metals remain good buys after pullbacks, so long as economic conditions remain the same, with central banks continuing to buy, and Safe-Haven investments expected to remain popular. Bitcoin (ruled by Uranus) showed some life mid-week, but ended about even from last week, as Uranus has turned direct in Taurus (money). Its Fear & Greed Index remains in Extreme Fear territory, though it rose about 5 points from last week’s close, suggesting a possible bounce. Stay cautious until a clear uptrend has developed.
***As always, this information is not intended to be financial advice, or any specific buy or sell recommendation, but rather a guide to assist the reader in some further understanding of current economic conditions/movements in the sky, and how they can affect moods, behaviors, world events, and financial markets.