FEAR & GREED INDEX 31
Weekly Update
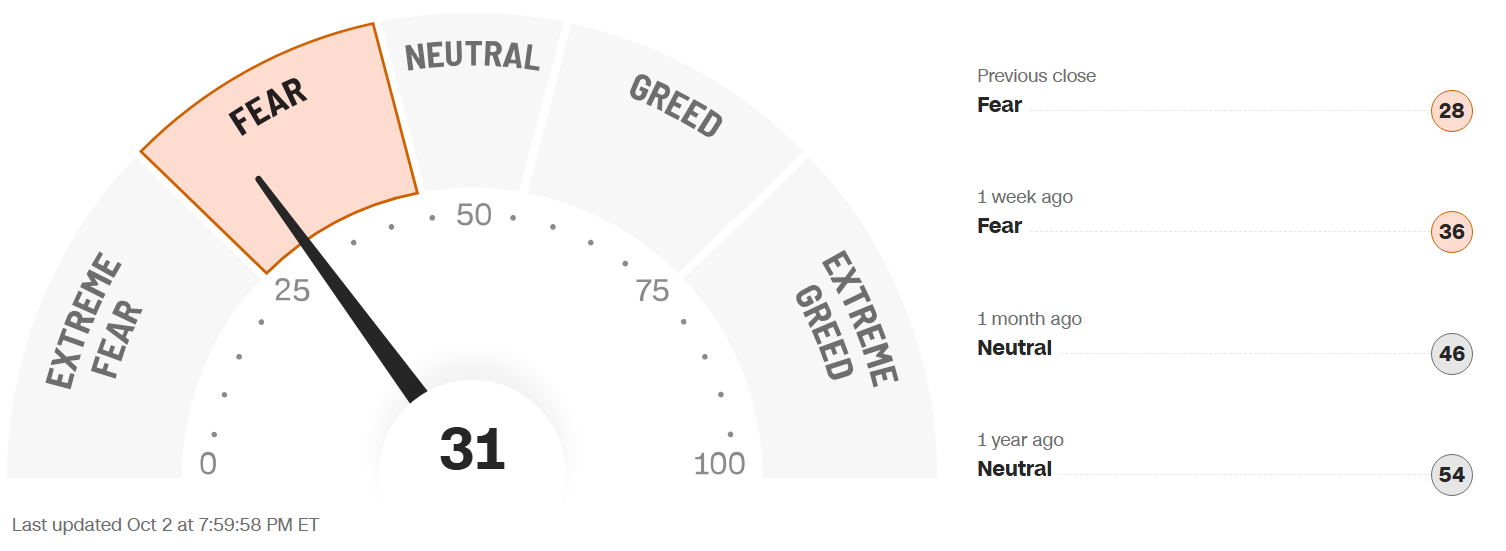
The Fear & Greed Index (found on cnn.com) is one of the easiest indicators to use to determine current market emotion. This simple to read gauge, highlighted in our publication When to Buy and When to Sell: Combining Easy Indicators, Charts, and Financial Astrology (available on Amazon), is measured in a range from 0-100, and currently reads 31 as of the close on Friday, October 2, 2026.
The gauge slipped deeper into the Fear category this week, declining 6 points from last week’s close of 37, though the S&P 500 only decreased about 21points, from 7,743 to 7,721, after Friday’s rally, which did subside throughout the day.
The 7 internal factors used to formulate this gauge are listed on the screen (below):
Market Momentum – (S&P 500 vs its 125-day moving avg) = FEAR
Stock Price Strength (# of new 52-week highs vs new 52-week lows) = EXTREME FEAR
Stock Price Breadth (# of shares rising vs falling on NYSE) = EXTREME FEAR
Market Volatility (measured by the VIX) = NEUTRAL
Put to Call Ratio 5-day avg. (# of Puts (bearish) vs Calls (bullish) = FEAR
Safe-Haven Demand (which measures stocks vs bonds) = NEUTRAL
Junk Bond Demand (non-govt. bond yield spread) = FEAR
This week, 2 of these 7 factors changed levels, as sentiment in all momentum categories remain low, reflecting the continued fragile underlying structure of the markets in this seasonally weak period. The all-important Put-to-Call Ratio flipped again (we seem to say this every week), as traders can’t seem to make up their minds past a day or two.
Moving Averages’ (MAs) bearish sentiment continued, with the longer-term 200-days in an official “bear” market (under 50%), now sitting at 43% (vs last week’s close of 45%), with the DJIA still leading at 60%, down from 63%. The shorter-term MAs declined again, to 28% on the 50-day (vs 30% last week), and rose slightly to 30% on the 20-day (vs 29% last week), after Friday’s rally. Sector strength was very fragmented once again this week, as most continued to decline, with only Infotech and Energy remaining strong in the short-term, while almost all others continue to slide. A “Red-Alert” has also been sent by the Financials as not a single stock is trading over its 20-day MA, and only 3% over their 50-days.
The “Risk-On” sentiment has mainly muted, as uncertainty regarding the military conflict and rising interest rates continue to control the market. 10-yr bond yields remain elevated, as they have for several weeks, ending the week up 0.1 points, to 5.27%, from last week’s close of 5.17%. Bond yields remain well over the 5% mark for the first time since October of 2023, and only the second time since 2007, just prior to the Global Financial Crisis. This level is reflected in the Mannarino Risk Index (highlighted in our monthly Indicator Insights review), which rose again, by 10 points, and now reads 334, vs last week’s 324, firmly into the mid-Extreme Risk level (max is 350), closing over 300 for the first time in 18 months, for the 3rd straight week. Despite being near all-time highs, the market is very nervous, and only being led heavily by the MAGS.
The VIX (market volatility), ticked up slightly, increasing 0.5 points, to 15.3 vs last weeks close of 14.8, but remained surprisingly low for this time of year. As we often note, however, any break-through of the crucial “20” mark suggests a pullback.
Economic reports this week focused on employment and inflation measures. The Gross Domestic Product (GDP) (economy) and the Personal Consumption Expenditures (PCE) (inflation) were both higher-then-expected, sending rates higher. Then, the Non-Farm Payroll report on Friday morning was a surprise, as the 29,000 jobs added was much-less-than the expected 89,000, which suddenly lowered the likelihood of another rate hike, and lifted bonds, propelling the markets.
Astrologically, Libra season began last Wednesday, September 23, lasting through October 22, 2026. As noted, Libra signifies balance, fairness, and justice, though the market itself is mainly based on emotion and sentiment. Currently, major uncertainty and nervousness persist in market conditions, despite recent highs, which is not expected to change anytime soon, so proceed with caution. Please review our Sign Language – Libra blog, dated 9-8-26 for more details.
Current shorter-term transits/aspects of note include the planet Venus, which remains in the sign of Scorpio (Sept 10 – Oct 25), signifying increased volatility from the calmer Libra. Also, a Venus Retrograde period has begun this weekend (Oct 3), which is traditionally negative for the markets. The planet Mercury is also transiting Libra (Sept 10 – Sept 30), signifying more balance and less harsh judgments. The communications and infotech sectors have risen during this time frame, however, there will also be another Mercury Retrograde period (also very challenging for the markets), beginning October 24. Both retrogrades will last through the Mid-Term Elections, and end in mid-November. Please review our Did You Know – About the Mid-Term Elections blog, dated 9-23-26, for more details.
Longer-term, the planet Jupiter remains in the sign of Leo until July 26, 2027, highlighting fashion, self-pleasing products, creativity, and travel (signified by the Consumer Discretionary sector), as well as leadership, defense, and gold (Please refer to our Trader Transits – Jupiter in Leo blog, dated 6-12-26, for further information). Stocks in those sectors (especially defense and gold) have shown some improvement, as expected, though discretionary stocks have stalled with recent low Consumer Sentiment and Confidence readings, as well as rising interest rates. Keep in mind that travel-related stocks have slumped due to their sensitivity to oil prices, which are vulnerable to the military conflict status (or “perceived” status).
Also, as discussed heavily in recent months, Uranus (sudden, unexpected events/high technology) will remain in the sign of Gemini (communications, transportation, advanced technology) until 2033. The current Uranus retrograde (Sept 10 - Feb 8, 2027), as explained in our recent Planet Power – Uranus Retrograde blog, dated 9-3-26, does not usually affect the market negatively. Uranus’ energies do continue, with quick, unexpected reversals, in both directions, however, as the market remains choppy and cannot seem to make up its mind (Gemini). This “divergence” is expected to continue in the short-term, as we’ve expressed in the past several weeks. Please also review our Trader Transits – Uranus in Gemini blog, dated 3-30-26.
As we have noted for over 1 year now, sectors of the technology industry that are likely to continue their advance into the future include AI, robotics, quantum computing, and space development, with both Pluto positioned in Aquarius, and Uranus in Gemini, for many years to come, though they will experience pullbacks (sometimes sizeable) along the way.
Gold (ruled by the Sun), and Silver (ruled by the Moon), rose steadily this week, until Friday, as the U.S. Dollar remains strong with another potential rate hike. The Gold to Silver Ratio closed at 68.5, rising 2.9 points from last week’s close of 66.6, but remains neutral as both metals continue to move together evenly, with no real bias toward either one. As we continue to stress, both metals remain good buys after pullbacks, so long as central banks continue to buy, which they are, and Safe-Haven investments remain popular, which is expected. However, there may be a further pullback as another rate hike is increasingly expected in October.
Finally, Bitcoin (ruled by Uranus), continues to consolidate, after a recent surge, and volume remains very low. Its Fear & Greed Index slipped a bit, but remained at the Greed level, ending the week at 67, after closing last week at 73. The Clarity Act, a bill designed to regulate the cryptocurrency and blockchain spaces in the U.S., which was helping to boost the sector, after advancing through the committee on Friday, July 24, awaits the next step as it recently did NOT receive Senate approval. Please review our Did You Know? – About The Clarity Act blog, dated 7-26-26, for further information.
***As always, this information is not intended to be financial advice, or any specific buy or sell recommendation, but rather a guide to assist the reader in some further understanding of current economic conditions/movements in the sky, and how they can affect moods, behaviors, world events, and financial markets.