FEAR & GREED INDEX 32
Weekly Update
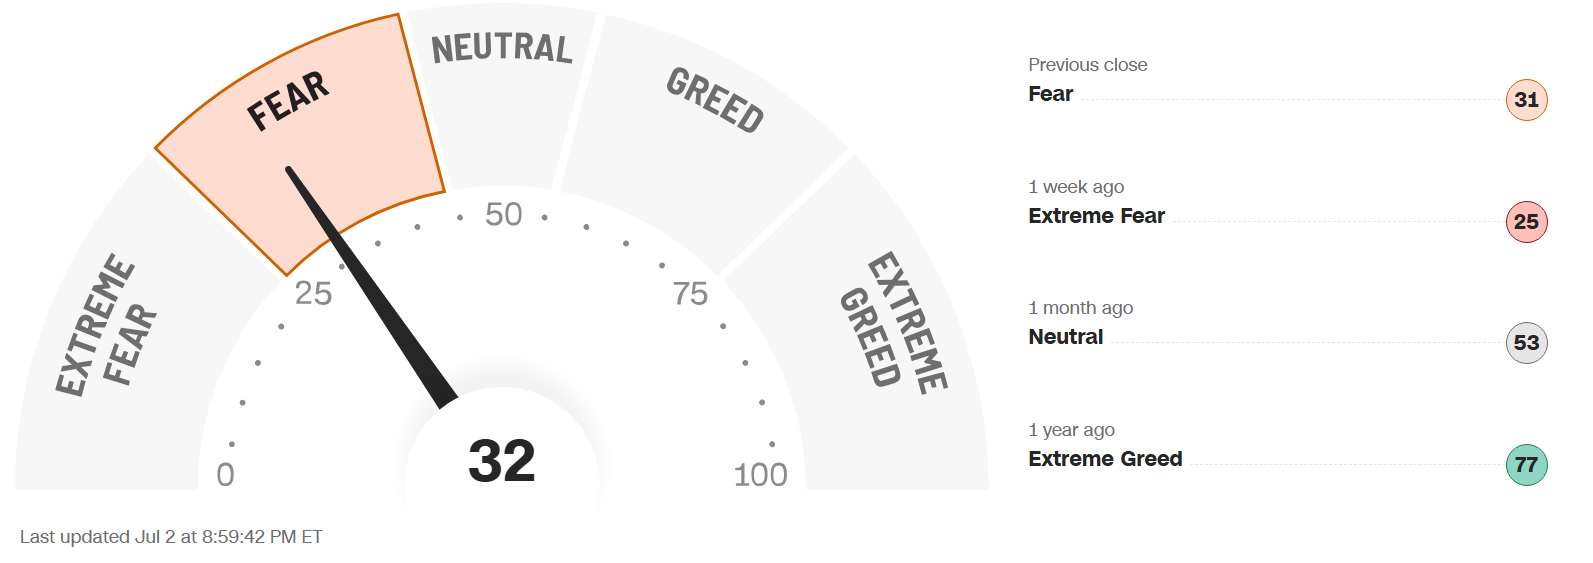
The Fear & Greed Index (found on cnn.com) is one of the easiest indicators to use to determine current market emotion. This simple to read gauge, highlighted in our publication When to Buy and When to Sell: Combining Easy Indicators, Charts, and Financial Astrology (available on Amazon), is measured in a range from 0-100, and currently reads 32 as of the close on Thursday, July 2, 2026.
The gauge improved slightly from Extreme Fear to Fear, rising 7 points from last week’s close of 25. This was reflected in the S&P 500, which gained 129 points, from 7,354 to 7,483, in this holiday-shortened week. As noted last week, a bounce off the Extreme Fear level was likely nearing, which occurred on Monday and into Tuesday.
The 4 major indexes’ 200-day MAs (Moving Averages) internal sentiment remained solidly in the bullish zone, with the Dow Jones again hitting all-time highs. The number of stocks making new highs on all indexes now sits at 59%, now led by the DJIA at 77%. The shorter-term 20 and 50-day MAs have also leveled off, with all in the 59-69% range, as technology stocks strengthened again. Sector rotation has helped even off the markets in recent sessions.
The “Risk-On” sentiment was rather neutral all week, with likely possible rate hikes in the future by the Federal Reserve (unless inflation can be tamed) continuing to weigh on the mind of investors. Mixed signals are being sent by the Fed, which keeps the market on edge. 10-yr bond yields rose again, to 4.49%, up from last week’s close of 4.38%, as interest rate policy uncertainty continues. Quarterly Window Dressing, in addition to the Russell Re-Alignment (discussed in our publication and recent Financial Focus - Russel Re-Alignment blog, dated 6-1-26), did appear to boost markets on Monday and Tuesday.
The 7 internal factors used to formulate this gauge are listed on the screen (below):
Market Momentum – (S&P 500 vs its 125-day moving avg) = NEUTRAL
Market Volatility (measured by the VIX) = NEUTRAL
Put to Call Ratio 5-day avg. (# of Puts (bearish) vs Calls (bullish) = FEAR
Stock Price Strength (# of new 52-week highs vs new 52-week lows) = FEAR
Stock Price Breadth (# of shares rising vs falling on NYSE) = EXTREME FEAR
Safe-Haven Demand (which measures stocks vs bonds) = EXTREME FEAR
Junk Bond Demand (non-govt. bond yield spread) = EXTREME FEAR
This week, 2 of these 7 factors changed levels, as Market Momentum improved from Fear to Neutral, and Stock Price Strength moved from Extreme Fear to Fear. The all-important Put to Call Ratio remains at the Fear level, after turning upward again the last two days of the week, in a continued topsy-turvy market.
The VIX, measured by Market Volatility, decreased this week, a good sign in the short-term, as it ended down 2.6 points, at 15.8, vs last weeks close of 18.4. The end of June into July is normally met with less volatility, due to seasonality, as well as low volume, due to many traders and institutions taking summer vacations. As we often note, any break-through of the crucial “20” mark suggests a pullback, so keep an eye on this gauge.
Economic data was mixed this week, with jobs and manufacturing a bit weak, and a slight improvement in consumer sentiment. Real estate was in-line with expectations regarding construction and mortgage applications.
Astrologically, we move through Cancer season (June 21 – July 21), normally a strong performing period for stocks. Cancer, a water sign, is known for its protective, emotional energies, as well as favorable equities market returns. Please review our Sign Language – Cancer blog, dated 6-8-26 for more details.
Mercury, the planet of trading, currently transiting the sign of Cancer (remaining for over 2 months until Aug 9), began its 3-week retrograde period, on Monday (June 29). As we often note, Mercury Retrograde is historically a time of re-assessment, reversals, retreat, and review, normally coinciding with fluctuations in the markets, usually to the downside. The energies of this retrograde will battle the normally favorable Cancer energies, relating to intraday reversal tendencies, and emotional reactions. Please review our past Planet Power – Mercury Retrograde blogs.
The planet Venus (for another week through July 9), and now the sign of Jupiter, are transiting the sign of Leo (please refer to our Trader Transits – Jupiter in Leo blog, dated 6-12-26), highlighting fashion and self-pleasing products, travel (signified by the Consumer Discretionary sector), as well as defense and gold. Stocks in that sector had been beaten down over the past several months, but have shown improvement (as expected), which would continue along with rising consumer sentiment.
The planet Mars entered the sign of Gemini last weekend (remaining through Aug 10), a more comfortable sign, after leaving Taurus, a slow-moving earth sign. Mars picks up the pace again in this air sign, but be conscious to avoid being too impulsive. The Mars conjunction with the planet Uranus occurs this weekend, which has already kicked in with sudden, intra-day reversals, and could provide more fireworks (pun intended) in the markets. Please review our recent Trader Transits – Mars conjunct Uranus blog, dated June 22, for more information.
As discussed heavily in recent months, Uranus (sudden, unexpected events/high technology) transits the sign of Gemini (communications, transportation, advanced technology) until 2033. Uranus’ energies have been on full display of late, with quick, unexpected reversals, and do not be “surprised” if this type of market action continues with these other planetary transits. Please also review our Trader Transits – Uranus in Gemini blog, dated 3-30-26, for more details.
Leading sectors have changed for the time being, as we noted with the “Sector Rotation.” Energy remained low once again with oil’s drop based on the perception of the status of the military conflict. Financials, which is always important for a bullish market, Healthcare, and Utilities remain strong. Keep in mind that the “rotation” is better for the market than liquidating to cash or turning to bonds in a “flight-to-quality.” Also, this Tuesday, July 7, 2026, SpaceX (SPCX) will open as part of the Nasdaq 100, due to the new “Fast Entry” rule, discussed in our Did You Know – The Nasdaq Changed the Rules blog, dated 6-6-26.
As we continued to stress, sectors of the technology industry that are likely to continue their advance into the future include AI, robotics, quantum computing, and space development (recent surge), with both Pluto positioned in Aquarius and Uranus in Gemini, for many years to come, though they will experience pullbacks along the way.
Gold (ruled by the Sun), and Silver (ruled by the Moon), after dropping on Monday morning, showed some signs of improvement this week, with a slight break in the recent strength in the U.S. Dollar. There are a lot of rumors about a “reset” concerning gold in the next two weeks, and it may be better to “wait and see” regarding new positions. The Gold to Silver Ratio closed at 66.8, a decrease of 2.3 points from last week’s close of 69.1, remaining rather neutral. As we continue to stress, both metals remain good buys after pullbacks, so long as central banks continue to buy, and Safe-Haven investments remain popular, which is expected.
Finally, Bitcoin (ruled by Uranus) seems to have found a bottom, hopefully, and is currently consolidating. Its Fear & Greed Index closed at 21, vs last week’s close of 16, moving just above Extreme Fear, into Fear territory. As we mentioned the last two weeks, look for some improvement in the beaten down sector as levels may have reached a buying opportunity.
***As always, this information is not intended to be financial advice, or any specific buy or sell recommendation, but rather a guide to assist the reader in some further understanding of current economic conditions/movements in the sky, and how they can affect moods, behaviors, world events, and financial markets.