Weekly Update
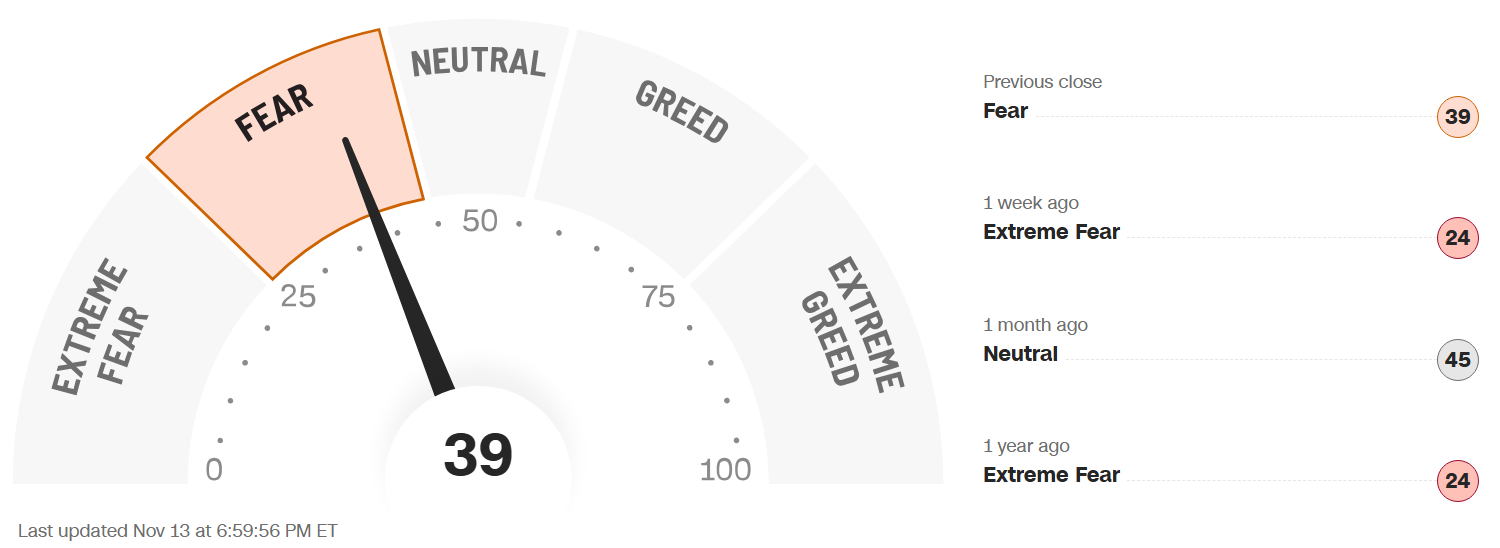
The Fear & Greed Index (found on cnn.com) is one of the easiest indicators to use to determine current market emotion. This simple to read gauge, highlighted in our publication When to Buy and When to Sell: Combining Easy Indicators, Charts, and Financial Astrology (available on Amazon), is measured in a range from 0-100, and currently reads 39 as of the close on Friday, November 13, 2026.
The gauge now sits in the Fear category this week, improving 17 points from last week’s close of 22. This was reflected in the S&P 500, which gained 185 points, from 7,376 to 7,561, after another wild week on Wall Street. Remember, the Extreme Fear level often suggests a rally in the near future, which proved true once again after last week’s plunge.
The 7 internal factors used to formulate this gauge are listed on the screen (below):
Market Momentum – (S&P 500 vs its 125-day moving avg) = EXTREME FEAR
Stock Price Strength (# of new 52-week highs vs new 52-week lows) = FEAR
Stock Price Breadth (# of shares rising vs falling on NYSE) = NEUTRAL
Market Volatility (measured by the VIX) = NEUTRAL
Put to Call Ratio 5-day avg. (# of Puts (bearish) vs Calls (bullish) = FEAR
Safe-Haven Demand (which measures stocks vs bonds) = EXTREME FEAR
Junk Bond Demand (non-govt. bond yield spread) = GREED
This week, 3 of these 7 factors changed levels, as both the VIX and the Put to Call Ratio moved out of the Extreme Fear level. The improvement did not fully quell the volatility, however, and continued caution is suggested for the time being.
Overall market internals Moving Averages’ (MAs) sentiment stubbornly remains bearish, as the longer-term 200-days ended the week slightly improved at 46% (vs last week’s close of 43%), with the DJIA still leading at 67%, (up from last week’s close of 63%). The shorter-term MAs now read 45% on the 50-day (vs 42% last week), and 48% on the 20-day (vs 47% last week), also showing a slight increase. Both the Nasdaq 100 and the interest rate sensitive Russell 2000 small-cap remain below the 50% mark, dragging the overall market sentiment down. Sector strength remained fragmented this week, as Energy reversed higher, interest rate-sensitive Real Estate and Consumer Discretionary plunged, while defensive sectors Utilities and Consumer Staples remained steady.
The “Risk-On” sentiment decreased this week, with the NVIDIA led technology decline. 10-yr bond yields also rose, ending the week up by 0.28 points, at 5.14% vs last week’s close of 4.86%, climbing back over 5% for the first time in a couple of weeks.
The VIX (market volatility), fell this week, finishing at 19.3 vs last week’s close of 25.4, suggesting overall calmer markets after the elections. As we often note, any break-through of the crucial “20” mark suggests a pullback, which occurred last week, though the market fluctuated heavily again this week. As long as this gauge remains elevated, the volatility and high risk will continue.
The obvious focus this week which overshadowed economic reports was the turmoil caused by the NVIDIA scandal. Panic selling ensued, and the legitimacy of all the facts, and more importantly the effect on the company, will be sorted out in the short term. Ironically, the company reports earnings after the close this coming Tuesday, November 17, 2026. The history of the company is blowout earnings beats, along with positive guidance. This will likely continue though the future remains uncertain until the smoke settles. The Producer’s Price Index (PPI) quietly came in slightly better than expected, and many other technology companies have reported very positive earnings results.
Astrologically, Scorpio season continues until next weekend (Oct 23 – Nov 21), before giving way to Sagittarius season (Nov 22 – Dec 21). Scorpio’s sharper, Mars led aggressive energies, signifying stronger rallies, or drops, in equity price action (which has seemed to occur daily) seasonally turns to holiday positivity. Please review our Sign Language – Sagittarius blog, dated 11-7-26, for more details.
Mercifully, both the Venus Retrograde (Oct 3 – Nov 14), and the Mercury Retrograde (Oct 24 – Nov 15), which held up to their reputations as traditionally negative and highly volatile for the markets, end this weekend. Both retrogrades displayed their prowess over these time frames, though the completion provides hope for calmer market conditions. For the record, this Venus Retrograde period ended with a 2% loss in the S&P 500, while the Mercury Retrograde logged an almost 1% decline. The losses are moderate, though they came in an historically stronger time of year, along with high volatility.
Longer-term, the planet Jupiter remains in the sign of Leo until July 26, 2027, highlighting fashion, self-pleasing products, creativity, and travel (signified by the Consumer Discretionary sector), as well as leadership, defense, and gold (Please refer to our Trader Transits – Jupiter in Leo blog, dated 6-12-26, for further information). Consumer Discretionary stocks, that usually rally in the holiday shopping period, have stalled with continued low Consumer Sentiment and Confidence readings, based on high interest rates. Travel-related stocks (sensitive to oil prices) finally received a boost with the large drop in crude oil, though remain vulnerable with the ongoing military conflict status (or “perceived” status).
Also, as discussed heavily in recent months, Uranus (sudden, unexpected events/high technology) will remain in the sign of Gemini (communications, transportation, advanced technology) until 2033. Uranus’ energies have continued since the end of May, when Uranus entered the sign, with unexpected reversals in both directions (especially with technology), as the market remains choppy and cannot seem to make up its mind (Gemini). Please also review our Trader Transits – Uranus in Gemini blog, dated 3-30-26.
As we have noted for over 1 year now, sectors of the technology industry that are likely to continue their advance into the future include AI, robotics, quantum computing, and space development, with Pluto positioned in Aquarius, and Uranus in Gemini, for many years to come, though they will experience pullbacks (sometimes sizeable) along the way.
Gold (ruled by the Sun), and Silver (ruled by the Moon), suffered this week, with the closing in of another rate hike, causing a higher U.S. Dollar. The Gold to Silver Ratio rose to 79.6, an increase of 1.3 points from last week’s close of 78.3. The level remains rather neutral, though slightly favoring silver. We have stressed over the past several months that both metals remained good buys after pullbacks, so long as central banks continue to buy and Safe-Haven investments remain popular. Central banks have recently been a bit erratic with their purchases, however, as rising treasury yields have made bonds more popular in the short-term.
Finally, Bitcoin (ruled by Uranus), declined this week, as crypto has again fallen out of favor. Its Fear & Greed Index dropped to the Extreme Fear level once again, ending the week 18 points lower, at 14, after closing last week at 32. No current catalyst is present for crypto, as the recently discussed Clarity Act has stalled in the Senate and still awaits the next step. Please review our Did You Know? – About The Clarity Act blog, dated 7-26-26, for further information. A bounce may be coming due to potentially “oversold” conditions, though current conditions are muted for this asset class.
***As always, this information is not intended to be financial advice, or any specific buy or sell recommendation, but rather a guide to assist the reader in some further understanding of current economic conditions/movements in the sky, and how they can affect moods, behaviors, world events, and financial markets.