FEAR & GREED INDEX 40
Weekly Update
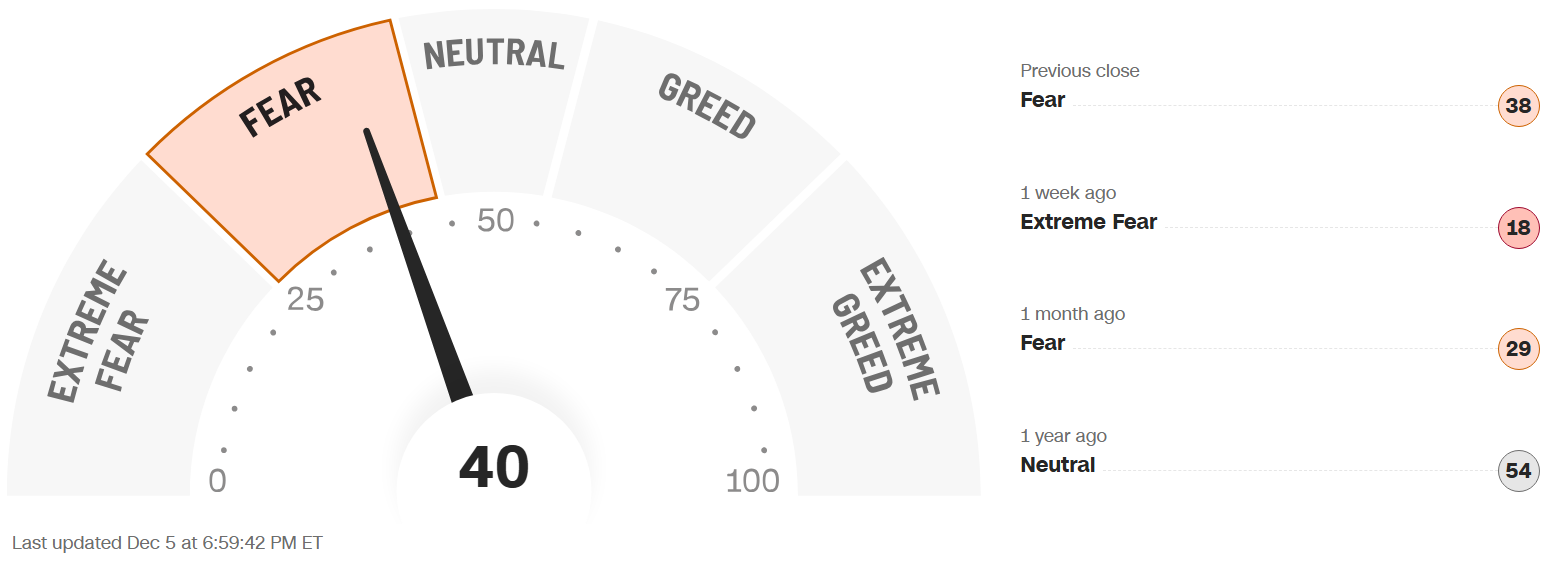
The Fear & Greed Index (found on cnn.com) is one of the easiest indicators to use to determine current market emotion. This simple to read gauge, highlighted in our publication When to Buy and When to Sell: Combining Easy Indicators, Charts, and Financial Astrology (available on Amazon), is measured in a range from 0-100, and currently reads 40 as of the close on Friday, December 5, 2025.
This figure increased to the upper Fear level, after rising 16 points from last week’s close of 24, as markets partially recovered from the recent pullback. This was reflected in the S&P 500, as it gained 21 points, from 6,849 to 6,870, after a gradual rise after Monday’s negative day. As expected, the markets have rallied after the extremely low reading of 8 on November 20, when the S&P 500 closed at 6,538. Though there is never a set time frame or guarantee for a bounce, this rally has fallen in line with the theory of this gauge.
The 4 major indexes (S&P 500, Nasdaq, Dow Jones Industrial, and Russell 2000), have continued their internal bullish 200-day moving averages, with all now between 60-67%, with the DIA leading at 67. Each index’ shorter-term 20 and 50-day MAs skyrocketed the past 2 weeks, with all maintaining their short-term strength. The seasonal strength seems to have finally kicked in, after an unusually weak first 3 weeks of November (the most favorable month for equities over the past few decades), leading into December, a month where fund managers alter their portfolios to buy leading stocks. The year-end bonus period for fund managers, the Santa Claus Rally, and Quarter-end window dressing are all in play in the upcoming couple of weeks.
The “Risk-On” sentiment resumed this week, but was a bit tempered, as the expectation of an interest rate cut in early December remains, but 10-year bond yields rose, closing the week at 4.14% vs last week’s close of 4.02%. The Bank of Japan’s early week announcement of possible rate hikes was also a factor in the rise. Keep in mind that next week’s expected rate cut has now been “priced-in” to the market, and the Fed Chair’s comments regarding future cuts will be more of a factor with market reaction.
The 7 internal factors used to formulate this gauge are listed on the screen (below):
Market Momentum – (S&P 500 vs its 125-day moving avg) = NEUTRAL
Market Volatility (measured by the VIX) = NEUTRAL
Put to Call Ratio 5-day avg. (# of Puts (bearish) vs Calls (bullish) = FEAR
Stock Price Strength (# of new 52-week highs vs new 52-week lows) = EXTREME FEAR
Stock Price Breadth (# of shares rising vs falling on NYSE) = FEAR
Safe-Haven Demand (which measures stocks vs bonds) = GREED
Junk Bond Demand (non-govt. bond yield spread) = FEAR
This week 5 of these 7 factors changed levels, as (not surprisingly) Market Momentum continued to improve, from Fear to Neutral. The VIX also showed significant improvement, moving back to Neutral, and Safe-Haven Demand jumped to Greed with the slump in the U.S. Dollar.
The VIX, measured by Market Volatility, declined once again, closing the week at 15.4, vs. last week’s close of 16.5, as market volatility and volume decreased. The crucial “20” level, has not been approached since November 24. The gauge is now reaching low levels where a reversal is probable, though not likely until after the new year, unless the Fed does not cut rates next week, or a Black Swan event occurs.
News this week included a very low Jobless Claims report on Wednesday, slightly under 200k, though it would not be surprising to see the figure revised in the future. The Personal Consumption Expenditures (PCE) report, an inflation indicator, also showed a slight increase of 0.1, though the information was from September, and did not cause any market reaction.
Earnings season is coming to an end, and overall has been mainly positive, with 3rd quarter growth of over 14% (when it was estimated around 7.2%), though record high layoffs continue to weigh on the economy. These mixed results have resulted in neither a crash, or surge, in the equities markets thus far.
Astrologically, Sagittarius season (ruled by the planet Jupiter) continues through December 21. Please see our recent Sign Language – Sagittarius blog, dated 11-4-25 for full details. The Sagittarius/Jupiter optimism and expansion, which usually results in favorable market conditions, may have started to surface.
The planet Mercury turned direct last weekend, and as expected, volatility calmed down for the time being.
The planet Venus, now in the sign of Sagittarius (until Dec 23), exudes holiday cheer, and a potential increase in retail spending. Venus’ energies are much more favorable in Sagittarius, also signifying more peace and harmony in financial arenas.
The planet Mars also continues to transit the sign of Sagittarius (until Dec 14), theoretically reducing aggression and volatility. As previously noted, Mars’ energies were very strong as it passed through its “home” sign of Scorpio, which resulted in divergent markets, despite all-time highs. Mars in Sagittarius can symbolize aggressive gains in the short-term, now that the Mercury Retrograde is over.
The planet Jupiter also remains retrograde in the sign of Cancer (until March 11). As previously discussed, Jupiter has very powerful expansive energies, which may weaken a bit for the time being.
Finally, the planet Uranus, which is currently in retrograde until early February, regressed from the sign of Gemini to the sign of Taurus (money), on Thursday, November 7, and will not return to Gemini until April, 2026. This 6-month re-visit to the sign of money (ruled by Venus), could create more shocks to the markets, in either direction, so beware. Please review our Planet Power – Uranus Retrograde blog, dated 8-27-25 for further details.
Leading sectors, with over 50% of stocks trading over their 200-MAs, continue to be led by Infotech, Healthcare, and Energy, while recent leader Utilities plunged in the short-term, suggesting a less “defensive” market sentiment. Real Estate continues to be the laggard, though another rate cut may help. In the long run, sectors of the technology industry that are likely to continue their advance into the future include AI, robotics, quantum computing, and space development (with Pluto positioned in Aquarius, and Uranus in Gemini for many years to come – when it returns in April), but will experience pullbacks along the way.
Gold (ruled by the Sun), and Silver (ruled by the Moon), surged again this week, suggesting equities investors continue to remain somewhat nervous with the dollar drop. The Gold to Silver Ratio (covered in our publication), slipped again, closing at 71.9, compared to last week’s close of 74.7, another yearly low, as silver has “outshined” gold of late. Both remain good buys after pullbacks in the current economic conditions, as central banks continue to buy. Bitcoin (ruled by Uranus) rallied a bit this week after its large down move (in lock-step with the Uranus retrograde back into Taurus), but remains skittish.
***As always, this information is not intended to be financial advice, or any specific buy or sell recommendation, but rather a guide to assist the reader in some further understanding of current economic conditions/movements in the sky, and how they can affect moods, behaviors, world events, and financial markets.