FEAR & GREED INDEX 58
Weekly Update
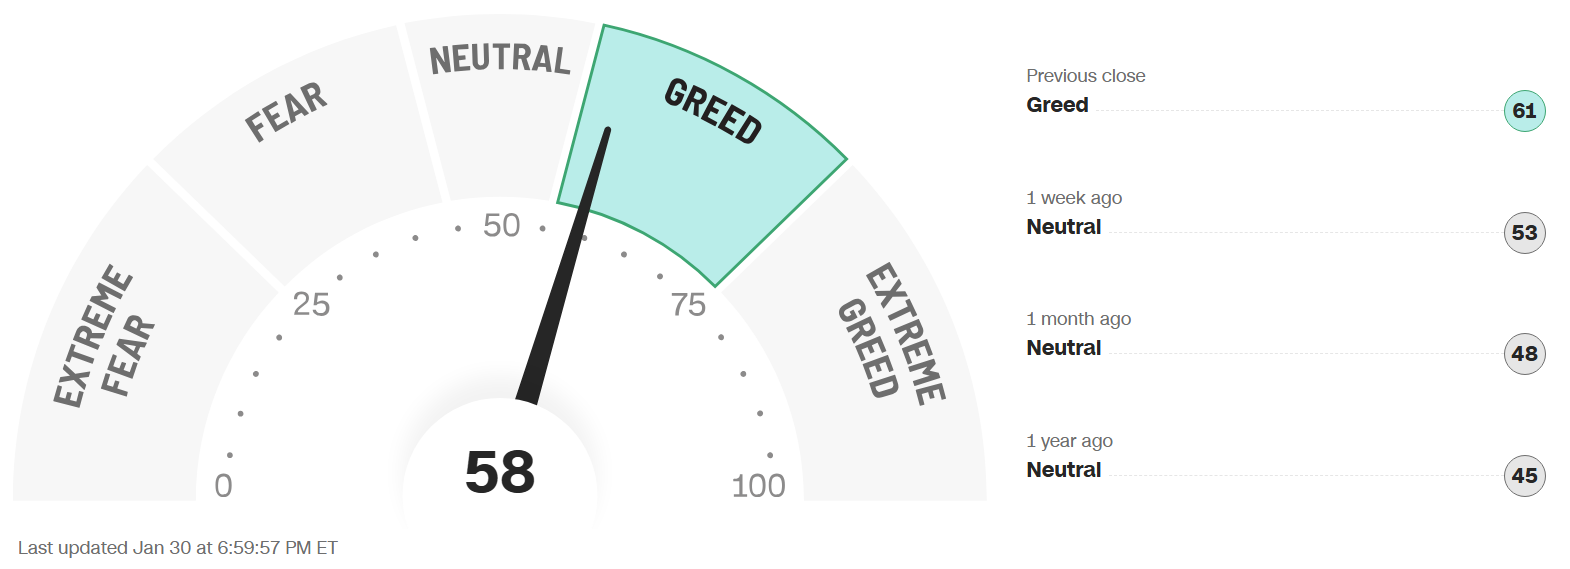
The Fear & Greed Index (found on cnn.com) is one of the easiest indicators to use to determine current market emotion. This simple to read gauge, highlighted in our publication When to Buy and When to Sell: Combining Easy Indicators, Charts, and Financial Astrology (available on Amazon), is measured in a range from 0-100, and currently reads 58 as of the close on Friday, January 30, 2026.
This figure held onto the Greed level, after rising 6 points from last week’s close of 52, though it had reached 64 on Tuesday. The S&P 500, however, after a solid start to the week, closed up just 24 points, from 6,915 to 6,939, as it sold off on Friday.
The 4 major indexes’ 200-day MA (Moving Average) internal bullish sentiment remained steady, as they continue to sit in the 60’s% range, with the DIA leading at 73%, though the Nasdaq 100 is just below at 58%. Each index’ shorter-term 50-day MAs remain healthy for the time being, although the 20’s declined, with the exception of the Dow. The January Effect, when “new” money traditionally is added to pensions, 401k’s, and invested in small caps (IWM), has come to an end, with a slightly over 1% gain in the S&P and a 4.8% increase in the IWM, despite a negative week.
The “Risk-On” sentiment had gained some traction early in the week, however, retreated at week’s end with no interest rate cut, or anticipation of one anytime soon. 10-year bond yields remained steady, again closing the week basically unchanged, at 4.24%, vs last week’s close of 4.23%, continuing to suggest the bond market is not quite convinced that the economy is in good shape. As noted for several weeks, yields on long-term bonds are likely to stay elevated until that sentiment changes.
The 7 internal factors used to formulate this gauge are listed on the screen (below):
Market Momentum – (S&P 500 vs its 125-day moving avg) = FEAR
Market Volatility (measured by the VIX) = NEUTRAL
Put to Call Ratio 5-day avg. (# of Puts (bearish) vs Calls (bullish) = EXTREME FEAR
Stock Price Strength (# of new 52-week highs vs new 52-week lows) = EXTREME GREED
Stock Price Breadth (# of shares rising vs falling on NYSE) = GREED
Safe-Haven Demand (which measures stocks vs bonds) = GREED
Junk Bond Demand (non-govt. bond yield spread) = EXTREME GREED
This week only 1 of these 7 factors changed levels, Safe Haven Demand, as it moved from Extreme Fear to Greed. This move was predicated by Friday’s massive drop in gold, silver, and other metals, after the previously noted over-extended conditions, and the naming of the new Federal Reserve Chairman, whose reputation favors preserving the value of the U.S. Dollar.
The VIX, measured by Market Volatility, rose almost 1 point, closing the week at 17, compared to last week’s close at 16.1. The crucial “20” level was pierced briefly last week (following the holiday weekend global uncertainty), for the first time since November 24, but remained under that level this week, peaking on Friday. Look for a continued rise in volatility going forward, as we enter February, one of the seasonally weakest months for equities over the past few decades. The chip sector does have strength historically around the middle of the month, however, so look for potential entry points.
News this week focused on the Fed meeting, earnings, and a few economic data reports. Both Gross Domestic Product (GDP), which saw a slight increase, and the Producers Price Index (PPI), inflation gauge, which was basically even, helped equal out the high volatility week. Rates were held steady, as expected, by the Fed, with a “wait and see” approached communicated for the near future. Earnings by major companies were mixed, causing the high volatility, and some reports remain delayed from the Fall government shutdown.
As we also discussed the past few weeks, we have now officially entered the 2nd year of the Presidential Cycle, known as the Mid-Term Year, which has historically posted the worst returns of the 4-year cycle, at least leading up to the elections. Please see our Did You Know – About the Mid-Term Election Year blog, dated 12-27-25 for more details.
Astrologically, we are in the midst of Aquarius season (ruled by the planet Saturn) (January 19 – Feb 18), which is the 11th sign of the zodiac, with financial implications. Please see our recent Sign Language – Aquarius blog, dated 1-6-26 for full details. Though the Saturn challenging energies of Capricorn continue (as Saturn also rules that sign), the collective symbolism of Aquarius has continued to be reflected in the broadening market (more stocks rising vs falling).
The planet Mercury, is also transiting the sign of Aquarius (January 20 - February 6), and “earnings season” announcements have continued to result in the expected volatility, with mixed results among the major large-cap companies. Mercury’s conjunction of Mars over last weekend, right on cue, resulted in aggressive global verbiage/announcements that affected the markets from the outset. Also, the next Mercury Retrograde occurs in a little less than a month (February 26 - March 20) in Pisces season, which will also likely coincide with the increased volatility we consistently note.
The planet Venus is also transiting the sign of Aquarius (Jan 17 - Feb 10), symbolizing some financial benefit across the masses, but also conjoined Pluto on Monday, Jan 19, signifying transformational financial conditions, which have been reflected around the world. Its upcoming square aspect with Uranus, on February 27, also signifies sudden impulsive financial events.
The planet Mars also entered the sign of Aquarius last Friday, Jan 23 (remaining until March 2), leaving behind the Capricorn challenging energies that had slowed Mars down (please see our Trader Transits - Mars square Saturn blog, dated 11-29-25).
Please also note that all 3 of these planets have now completed conjunctions with the planet Pluto throughout the past week (between the 19th and 27th of January), which is discussed in the same Sign Language – Aquarius blog, signifying more financial and political chaos across the globe.
The planet Jupiter remains in retrograde in the sign of Cancer (until March 11), and as previously discussed, Jupiter has very powerful expansive energies, which may weaken a bit for the time being.
Finally, the planet Uranus, which is currently in retrograde until February 4, remains in the sign of Taurus (money), and will not return to Gemini until April, 2026. This 6-month re-visit to the sign of money (ruled by Venus), could also create more shocks to the markets, in either direction, so beware. Please review our Planet Power – Uranus Retrograde blog, dated 8-27-25 for further details.
Leading sectors, with over 50% of stocks trading over their 200-day MAs, continues to include Industrials, Basic Materials, and Energy, with the increasing expectation of military conflict, however the laggards, Real Estate and Communicative Services (which basically led all of 2025), saw an uptick indicative of the “sector rotation shift”. Sectors of the technology industry that are likely to continue their advance into the future include AI, robotics, quantum computing, and space development (with Pluto positioned in Aquarius, and Uranus in Gemini for many years to come – when it returns in April), though they will experience pullbacks along the way.
Gold (ruled by the Sun), and Silver (ruled by the Moon), were strong again at the outset, until the massive selloff on Friday. The decline was not normal (as silver dropped 30%!), though we noted in the past few weeks the surge was unsustainable. The Gold to Silver Ratio (covered in our publication) rose about 9 points, closing at 57.3 after the massive decline, compared to last week’s close of 48.3. Silver had been outpacing gold, but declined much more percentage-wise on Friday, lessening the imbalance. Both remain good buys after pullbacks as economic conditions remain the same, with central banks continuing to buy, and Safe-Haven investments remaining popular. Bitcoin (ruled by Uranus) continues to struggle as the Uranus retrograde ends next week.
***As always, this information is not intended to be financial advice, or any specific buy or sell recommendation, but rather a guide to assist the reader in some further understanding of current economic conditions/movements in the sky, and how they can affect moods, behaviors, world events, and financial markets.