FEAR & GREED INDEX 59
Weekly Update
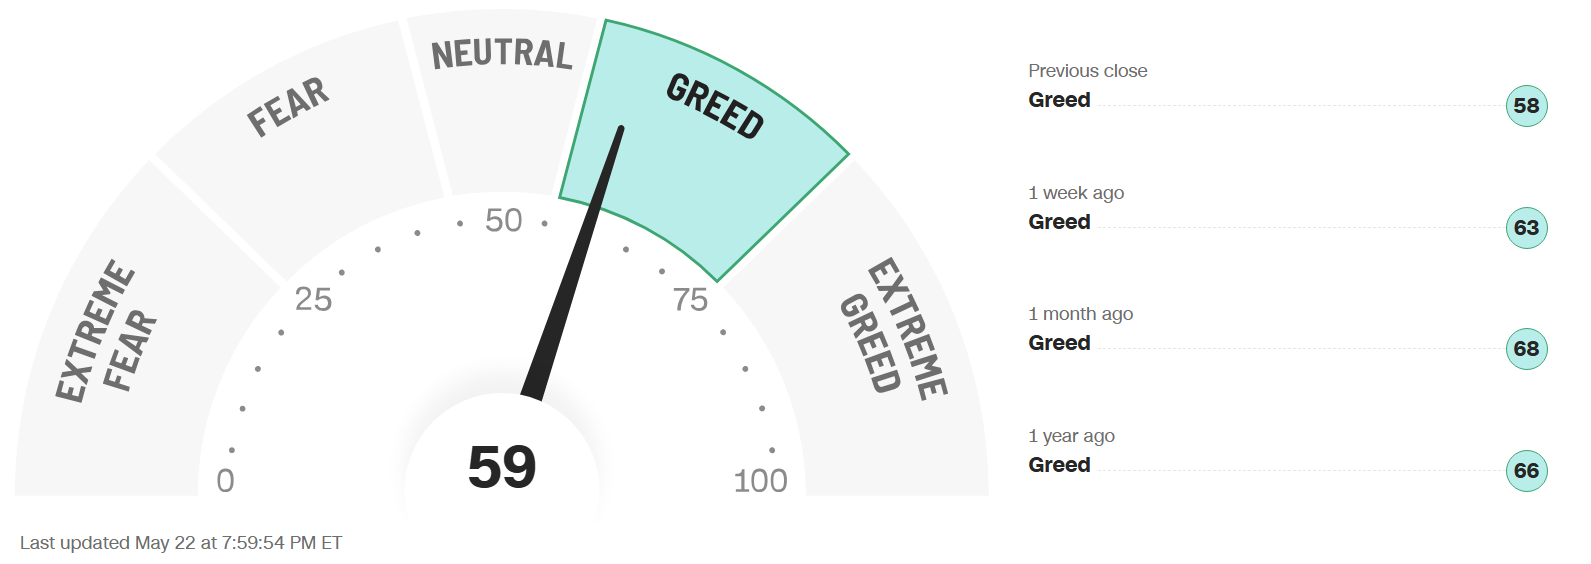
The Fear & Greed Index (found on cnn.com) is one of the easiest indicators to use to determine current market emotion. This simple to read gauge, highlighted in our publication When to Buy and When to Sell: Combining Easy Indicators, Charts, and Financial Astrology (available on Amazon), is measured in a range from 0-100, and currently reads 59 as of the close on Friday, May 22, 2026.
The gauge held on to the mid-Greed category this week, slipping 4 points, from last week’s close of 63. The S&P 500, however, increased another 65 points, rising from 7,408 to 7,473, gaining for the 8th straight week, now again bordering all-time highs. The slow decline over the past few weeks has now created less over-extended conditions, which levels out this reading.
The 4 major indexes’ 200-day MAs (Moving Averages) internal sentiment remained in the bullish zone, as the number of stocks making new highs on all indexes sits between 56-61%, with the Nasdaq now leading at 61%. The shorter-term 20 and 50-day MAs also improved this week, with all moving back over the 50% mark.
The “Risk-On” sentiment continued through the week, but cooled a bit on Friday after another positive week in the indexes. 10-yr bond yields closed slightly lower at 4.56% vs last week’s close of 4.6%, though high inflation reports and hints of interest rate hikes continue to keep yields dangerously high. Stagflation concerns, when the economy is slowing and inflation is rising, continues to be a concern.
The 7 internal factors used to formulate this gauge are listed on the screen (below):
Market Momentum – (S&P 500 vs its 125-day moving avg) = EXTREME GREED
Market Volatility (measured by the VIX) = NEUTRAL
Put to Call Ratio 5-day avg. (# of Puts (bearish) vs Calls (bullish) = EXTREME GREED
Stock Price Strength (# of new 52-week highs vs new 52-week lows) = FEAR
Stock Price Breadth (# of shares rising vs falling on NYSE) = FEAR
Safe-Haven Demand (which measures stocks vs bonds) = EXTREME GREED
Junk Bond Demand (non-govt. bond yield spread) = FEAR
This week, only 1 of these 7 factors changed levels, as Stock Price Strength continues to slide. This represents a decline in the ratio of stocks hitting 1-year highs vs those hitting 1-year lows, a negative internal factor in equities. The all-important Put to Call Ratio (used more by short-term traders) continues to be heightened at Extreme Greed, reflecting the enthusiasm of the markets, helping to suggest a possible pullback, which occurred from last Friday through this Tuesday. Though the market did recover in the last half of the week, the rally needs to continue to sustain itself.
The VIX, measured by Market Volatility, slowly declined this week, closing down 1.7 points at 16.7, vs last weeks close of 18.4, which kept markets in check. Any break-through of the crucial “20” mark would indicate a pullback as well.
After another week of no geopolitical conflict resolution, energy prices and inflation concerns persist. Investors have essentially assimilated the military conflict into the market to some extent, but it is very fragile and can change at any time. As noted over the last couple of weeks, the now 7-week bullish rally continues to show signs of divergence and over-extended conditions to the upside, as the gains were not widespread throughout the sectors.
Economic data was again mixed this week, with improved manufacturing and solid tech earnings. Housing categories were also mixed, with a decline in mortgage applications but steady housing starts, which have improved over the past 2 months. The Leading Economic Indicator Index also showed a slight tick up, as the decline over the past year has slowed. The earnings landscape was fully focused on Nvidia (NVDA), which reported their quarterly figures and outlook after the close on Wednesday. As usual, the numbers exceeded analyst expectations, and the company provided a positive future guidance, however, like many high growth stocks, the stock pulled back a bit from profit taking after running up prior to the announcement.
Astrologically, as we have entered Gemini season (May 21 – June 20), an air, 2-sided sign, which is seasonally more volatile than Taurus. As expected, the Taurus energies stabilized markets from the Aries aggression of late March and early April, which was reflected in the drop in the VIX and market gains in technology. Though Gemini season rarely suffers any major downturns, the gains are generally limited.
Mercury, the planet of trading, has also entered the sign of Gemini (one of its two “home” signs with Virgo) putting extra focus on communications and speech, and briefly forming a conjunction with Uranus. Proceed with caution, however, as the markets will likely “even” out with Gemini’s push and pull energies.
The planet Venus, whose transit through Gemini (which included a conjunction with Uranus), was favorable for the Communications, Transportation/Airlines, and high technology sectors, as noted, has now entered the sign of Cancer (May 18). This provides a shift to more “love of the home” stocks and sectors including cyber-security, and real estate/home improvement.
The planet Mars also changed signs last weekend, transiting from the sign of Aries (its “ruling” sign with Scorpio), to the sign of Taurus (May 17), cooling from its ultra-aggressive energies to more stable conditions. Mars in this sign tends to symbolize a lean toward longer-term plans (investments) rather than quick aggressive action. Last week we mentioned that Monday’s market could reflect the change, which did result in a negative day. This transit could also hold back Real Estate.
As noted, Mercury, Venus, and Mars (the shorter-term transiting planets) all changed signs within 2 days last weekend, which suggests more short-term uncertainty and volatility.
The much-anticipated Uranus (sudden, unexpected events/high technology) entry into the sign of Gemini (ruled by Mercury - considered a lower-level Uranus), is now complete, where it will remain until 2033. Gemini, like Uranus, represents high intelligence, communications, and technology, signifying major advances in those industries. Uranus’ energies were on full display again this week with quick, unexpected reversals. Do not be “surprised” if this type of market action continues with the Mercury and Uranus energies. Please review our Trader Transits – Uranus in Gemini blog, dated 3-30-26, for more details.
Leading sectors continued to include Energy (though it dropped the last couple of days), which is heavily dependant on the ever-changing status of the Middle-East conflict, and Utilities, which experienced a bit of a resurgence, with market uncertainty again rising. Meanwhile, Infotech, Consumer Discretionary, and Real Estate quietly continued to rise, though any rate increase in the future would change that sentiment.
As we continued to stress, sectors of the technology industry that are likely to continue their advance into the future include AI, robotics, quantum computing, and space development, with both Pluto positioned in Aquarius and Uranus in Gemini, for many years to come, though they will experience pullbacks along the way.
Gold (ruled by the Sun), and Silver (ruled by the Moon), oscillated this week, closing slightly lower. The Gold to Silver Ratio closed at 59.7, unchanged from last week’s close, remaining rather neutral, but slightly favoring gold. Both metals remain good buys after pullbacks, so long as economic conditions remain the same, with central banks continuing to buy, and Safe-Haven investments expected to remain popular. Bitcoin (ruled by Uranus) was steady until suddenly nosediving the last day and a half. As noted, Mercury in Gemini (with Uranus), also symbolizes advanced technology, including cryptocurrencies, and the conjunction of the two, combined with Venus’ move out of Gemini, has not been favorable. Its Fear & Greed Index now reads 33, slipping back into Fear territory, closing 12 points lower after last week’s close of 45. Look for the second half of June to be better than the first.
***As always, this information is not intended to be financial advice, or any specific buy or sell recommendation, but rather a guide to assist the reader in some further understanding of current economic conditions/movements in the sky, and how they can affect moods, behaviors, world events, and financial markets.