FEAR & GREED INDEX 66
Weekly Update
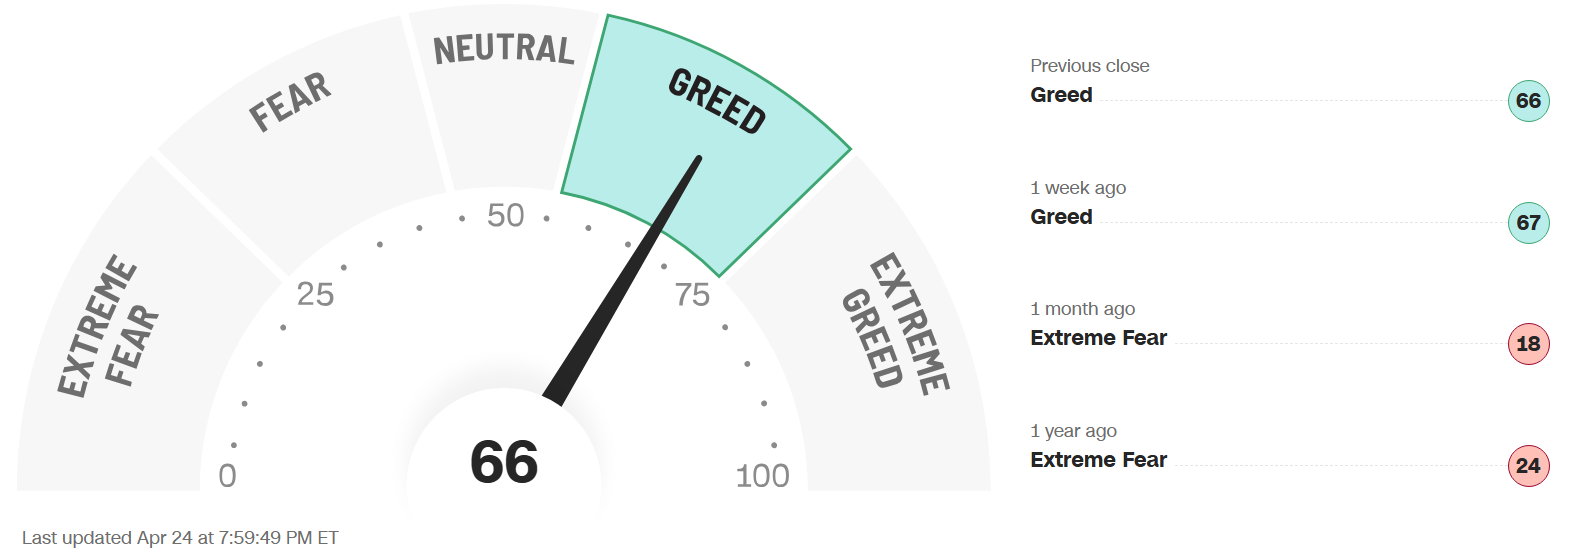
The Fear & Greed Index (found on cnn.com) is one of the easiest indicators to use to determine current market emotion. This simple to read gauge, highlighted in our publication When to Buy and When to Sell: Combining Easy Indicators, Charts, and Financial Astrology (available on Amazon), is measured in a range from 0-100, and currently reads 66 as of the close on Friday, April 24, 2026.
The gauge remains in the mid-Greed category, while slipping 2 points from last week’s close of 68. This was also reflected in the S&P 500, which edged up 39 points, from 7,126 to 7,165. The technology-heavy Nasdaq (which has recovered almost 20% from recent lows) broke its streak of 13 consecutive positive days on Monday, and was negative 3 of 5 days this week. However, it still saw significant gains by weeks end, gaining almost 300 points, led by semiconductor stocks that have replaced the MAGS as the catalyst to the index. The quick recovery since the end of March has now exceeded all-time highs. There is some bearish divergence forming in the indexes, however, as the Dow Jones lost ground, indicating caution in the short-term.
The 4 major indexes’ 200-day MAs (Moving Averages) internal sentiment has remained in the bullish zone, with the number of stocks making new highs easily exceeding 50% on all indexes, including recent laggard Nasdaq 100, now at 52%. The shorter-term 20 and 50-day MAs were mixed as the landscape changed due to some sector rotation. Be aware that the 50-day on the Dow has dropped below to 47% with the technology strength. The semiconductor sector ETF, ticker SMH, has now enjoyed an historical 18 consecutive days of gains, and sits in clear overbought/extended territory.
The “Risk-On” sentiment continued this week, despite back-and-forth reports concerning the cease-fire regarding the Middle-East military conflict. 10-year bond yields rose slightly, ending the week at 4.31%, vs last week’s close of 4.25%, though there was no change in sentiment that the interest rate policy will remain unchanged for the foreseeable future. Stagflation concerns, when the economy is slowing and inflation is rising, eased a bit with a positive start to earnings season.
The 7 internal factors used to formulate this gauge are listed on the screen (below):
Market Momentum – (S&P 500 vs its 125-day moving avg) = EXTREME GREED
Market Volatility (measured by the VIX) = NEUTRAL
Put to Call Ratio 5-day avg. (# of Puts (bearish) vs Calls (bullish) = FEAR
Stock Price Strength (# of new 52-week highs vs new 52-week lows) = FEAR
Stock Price Breadth (# of shares rising vs falling on NYSE) = GREED
Safe-Haven Demand (which measures stocks vs bonds) = EXTREME GREED
Junk Bond Demand (non-govt. bond yield spread) = NEUTRAL
This week, only 1 of these 7 factors changed levels, as the all-important Put to Call Ratio shifted from Extreme Greed to Fear. This suggests a change in short-term sentiment in the futures options market, indicating a possible pullback after the major surge. As the number of stocks hitting 1-month highs cooled off considerably this week, the rally may not have much strength left in the near-term.
The VIX, measured by Market Volatility, also rose a bit week, closing 1.2 points higher at 18.7, vs last weeks close of 17.5. The gauge closed beneath the crucial “20” danger-zone level all week, where it has remained since April 8, solidifying the general market.
The geopolitical conflict in the Middle East, and energy prices, still remained in focus as the market, news driven over recent weeks, seems to have assimilated the global military tensions into prices. Earnings kicked in this week with many major companies reporting, and results, though mixed, have exceeded expectations on the whole. Should that continue, the market may remain strong. One major catalyst on Friday was the earnings report and guidance from semiconductor leader Intel (INTC), which ignited the already surging sector.
Economic data was mixed this week, with positive housing reports, including pending home sales, and a 7.8% increase in mortgage applications (though 5.8% accounted for re-finances). Retail sales were also slightly higher, however, consumer sentiment plunged. This additional divergence in consumer-related issues has kept the Dow in uncertain territory. Again, caution is suggested as the combination of intermarket divergence, and rises in the Put-to-Call Ratio and VIX is concerning.
Astrologically, we have entered Taurus season (Apr 20 – May 20), stabilizing energies from the Aries aggression encountered since the onset of that season. Taurus (the 2nd sign of the zodiac, ruled by Venus), is a money sign, whose attributes also include logical, down-to-earth, calm energies, with a positive financial theme. As we have mentioned, the 2nd half of April generally sees a calm down in the market volatility (VIX), which again has been the case thus far.
Mercury, the planet of trading, continues to transit Aries (Apr 14 – May 2), symbolizing continued strong/sharp communication between leaders. The planet formed a conjunction with the planet Saturn on Monday, April 20, together with the Sun and Mars, signifying some restriction in the financial world, likely resulting in a pullback from over-extended conditions, which did occur on Monday and Tuesday in the S&P.
The planet Venus ended its short transit of Taurus on Friday, Apr 24, and will conjunct Uranus this weekend, as they both move into Gemini. Venus in Taurus was favorable for the Real Estate, Financial, and Consumer Discretionary sectors, as expected, which will likely cool off, and signifies positivity for Communications, Transportation/Airlines, and high technology, as it transits Gemini through May 18.
The planet Mars remains in the sign of Aries (its “ruling” sign with Scorpio), from April 9 – May 17 (birth date of the U.S. Stock Market), symbolizing ultra-aggressive energies. Mars formed a square with the planet Uranus a few weeks ago, resulting in a sudden plunge in the technology sector. The conjunction between the Sun, Mercury, and Mars, with Saturn, on April 20, ignited more fireworks in that sector, as suggested last week. Mars’ overzealous energies can be dangerous in an uncertain market, so again, be sure not to FOMO into any speculative stocks for the time being, as market sentiment has become over-exuberant.
As noted, the planet Uranus (sudden events/technology) finally exits the sign of Taurus (money), and enters the sign of Gemini (ruled by Mercury - considered a lower-level Uranus) this weekend, where it will remain until 2033. Gemini a sign of high intelligence, communications, and technology, signifies continued major advances in the technology field. Uranus’ sudden change energies were on full display this week once again, with massive reversals Tuesday – Friday. Do not be “surprised” if it continues. Please review our Trader Transits – Uranus in Gemini blog, dated 3-30-26, for more details.
Although the recent Saturn-Neptune conjunction (Feb 27), continues to separate, the effect is long-lasting with these slow-moving planets (explained the last several weeks). Both Saturn and Neptune will experience retrograde periods this summer, slowing the separation and extending their energies.
Leading sector Utilities dropped significantly this week with the Risk-On sentiment, while recent leader Energy moderated, after dropping the prior 2 weeks, based on oil’s decline on the perceived progress in ending the military conflict. Recent laggards, including Consumer Discretionary, Financials, and Real Estate continued upward off historic lows from only a few weeks ago, as expected, which we noted in this blog just a few weeks ago on March 29.
As we continued to stress, sectors of the technology industry that are likely to continue their advance into the future include AI, robotics, quantum computing, and space development (with Pluto positioned in Aquarius, and Uranus in Gemini for many years to come), though they will experience pullbacks along the way.
Gold (ruled by the Sun), and Silver (ruled by the Moon), had an inside week this week, as it traded within the high and low range of last week. The Gold to Silver Ratio (covered in our publication) finished the week at 62.1, after last week’s close of 59.8, remaining rather neutral, but slightly favoring gold. Both metals remain good buys after pullbacks, so long as economic conditions remain the same, with central banks continuing to buy, and Safe-Haven investments expected to remain popular. Bitcoin (ruled by Uranus) continues its upward trend, since its Feb 5 low (32% higher), picking up the pace from its long consolidation. Uranus’ ingress into Gemini (technology/transportation) accompanied by Venus (money) this week continues the positive sentiment that began with Venus in Taurus (money). Its Fear & Greed Index now reads 60, moving down slightly, but remaining in Neutral territory, after last week’s close of 63. Last month we suggested a possible bounce when the reading was 18, which has occurred with a slow, steady climb.
***As always, this information is not intended to be financial advice, or any specific buy or sell recommendation, but rather a guide to assist the reader in some further understanding of current economic conditions/movements in the sky, and how they can affect moods, behaviors, world events, and financial markets.