CHART CHAT
Inside the Consolidation
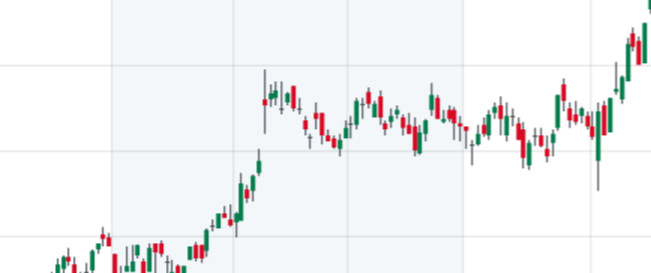
Figure 1
In this edition of Chart Chat, we will again discuss the Chart Pattern known as Consolidation. As covered in Chapter 2 of our publication When to Buy and When to Sell; Combining Easy Indicators, Charts, and Financial Astrology (available on Amazon), and our Chart Chat – Consolidation blog, dated 9-22-24, we explained how consolidation is a very popular pattern regularly used by investors and traders alike. The pattern basically suggests a brief “pause” in market direction, and “indecision” regarding market sentiment related to an index or equity, especially on a short-term basis.
Consolidation, sometimes referred to as “price discovery,” and/or “pockets of liquidity,” is a very easy pattern to recognize, works in all time frames, and allows some time for the investor or trader to contemplate their next move. In our publication, and the previous blog, we provide the basics of the pattern and variations of it, as well as several other patterns, for your general understanding.
A consolidation will often occur after a significant uptrend or downtrend, and develops clear support and resistance lines that form horizontally at common high and low price-pivots (reversal points). A Bull Flag or Bear Flag will also sometimes form a channel in the opposite direction of the trend, for a brief time, diagonally, before resuming the original trend (also displayed in our publication).
The above chart (Figure 1) displays a perfect example of a consolidation period in a stock that formed during an uptrend in price. The first “sideways” price movement occurred at the bottom left of the chart, which resulted in a “breakout,” followed by a continuation of the trend. The “range-bound” period created clear Support & Resistance price levels that could have been consistently traded until the second “break-out.”
After a second, longer, “price discovery” period, the stock again “broke out” to the upside, continuing the trend. This stock has been in a long uptrend, with two clear buying opportunities just after break-out confirmations.
As detailed in our 9-22-24 blog, the strength of a consolidation, or price discovery, “break-out” usually depends on three factors - the length of the consolidation, the number of times price “hits” the support or resistance line, and the height of the range between support and resistance.
While “recognition” is the key to any “pattern,” some are more difficult to identify than others based on price movements inside the pattern. Since consolidation is known to often continue the preceding trend of any equity, after the “breather” inside the “range” or “sideways” channel, it can be one of the easiest patterns to trade.
There are also additional ways to look “inside” the consolidation to detect more “clues” to the direction of the upcoming “break-out.” Since each trading session is represented by a bar or candle on a chart, the opening and closing price is identifiable. This allows the price action within the trading range/consolidation to potentially reveal which direction the “break-out” may occur. Please review the following 2 charts - Is there any difference other than the direction of the ultimate breakout?
The answer is yes. Not all sideways patterns will be quite as clear as these two, but for the sake of example, we chose two that were distinctly different.
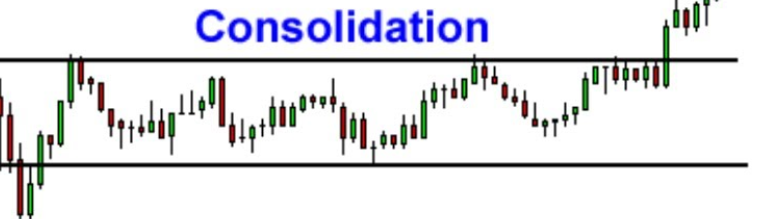
Figure 2
Figure 2 – Stock #1 price entered consolidation in an uptrend, and made a cycle high on the first touch of the top resistance line. The sideways range then formed between that price level and the lower support line. During the first half of the consolidation, the pattern looked more like a Bull Flag retrace, with a series of lower highs and lower lows, (the first sign of a trend continuation) though price never breached the support line. There were also bottom “wicks” present on each occasion where price approached support, indicating a strong buying/reversal point. As the pattern aged, the momentum changed, making higher lows, with several touches of resistance, while also forming an Ascending Triangle pattern in the last half of the consolidation. Also, price never really dropped below the mid-way point of the consolidation after the momentum change, nor did it ever fall to the original low point on the far left. This combination forms the “high probability” of an upward break, which did occur with a high-volume green candle, confirmed by the next green candle.
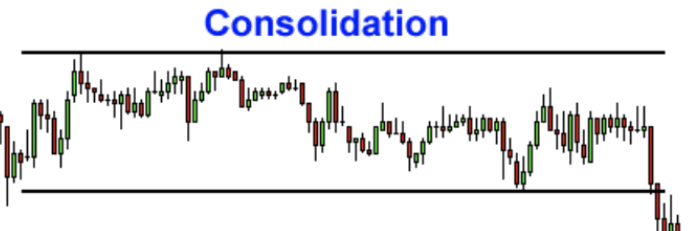
Figure 3
Figure 3 – Stock #2 also entered consolidation in an uptrend reaching its cycle high around the same point in the pattern. It also then started what could have been a Bull Flag retrace, though not as steep as Stock #1, and touched resistance on one occasion. It then began a slow period of lower highs and lower lows, which started to signify a rollover/reversal within the range. From the halfway mark, price never rose above the mid-point, and several top “wicks” appeared whenever it came close. Ultimately, price broke down through support on the second touch, with 2 large volume red candles, also falling below the low point to the far left, which was then confirmed by the next red candle. This was an example of a reversal, rather than a trend continuation.
At times price action inside the consolidation pattern will be less obvious or clear. In those instances, when an incline or decline cannot be detected, there can still be indications of where price is likely to move when the pattern breaks, though not as high a probability. On these instances, depicted in Figure 4, there may be a greater number of closes at or near the high of the session, or vice-versa.
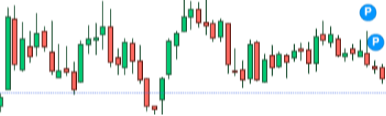
FIGURE 4
Figure 4 – Stock entered the consolidation period in an uptrend before becoming range-bound after a large green candle. The price action was pretty volatile, with many “wick” candles, especially when reaching Support & Resistance lines. During this time frame, channel trading would have been beneficial off those lines. As the pattern continued the number of positive days and negative days were basically even, until the bear sentiment took over near the end, though no definitive bear pattern had been established. This was an indication of trend reversal, as the selling pressure had finally become greater than the buying pressure, and the break did occur downward.
When combined with some other keys indicators, like volume, advance/decline line, and relative strength, this pattern can be very dependable, so long as it is “confirmed.” Learning to trade high-probability patterns can be a key to successful results.
In future editions of Chart Chat, we will continue to provide various technical pattern education, analysis, and potential price movement set-ups.
Astrologically speaking, planet positioning and transits through the zodiac houses, and signs, has many similarities to technical analysis. The theme of cycles, repeating patterns, and historical data can be viewed the same way, as the probabilities can be calculated from previous percentages of success. The difference is the use of an Ephemeris, a basic calendar of future planetary transits and aspects (see Chapter 4 of our publication for details), which allows for future positions to be known, unlike the next line, bar, or candle on a technical chart. Although no source will be 100% accurate, this extra layer can be very useful. For those interested, please refer to Trader Transits and U.S. Stock Market blogs on this site, as well as the last section of each weekly Fear & Greed Index update.
***As always, this information is not intended to be financial advice, or any specific buy or sell recommendation, but rather a guide to assist the reader in some further understanding of current economic conditions, chart analysis, or movements in the sky, and how they can affect moods, behaviors, world events, and financial markets.