FEAR & GREED INDEX 67
Weekly Update
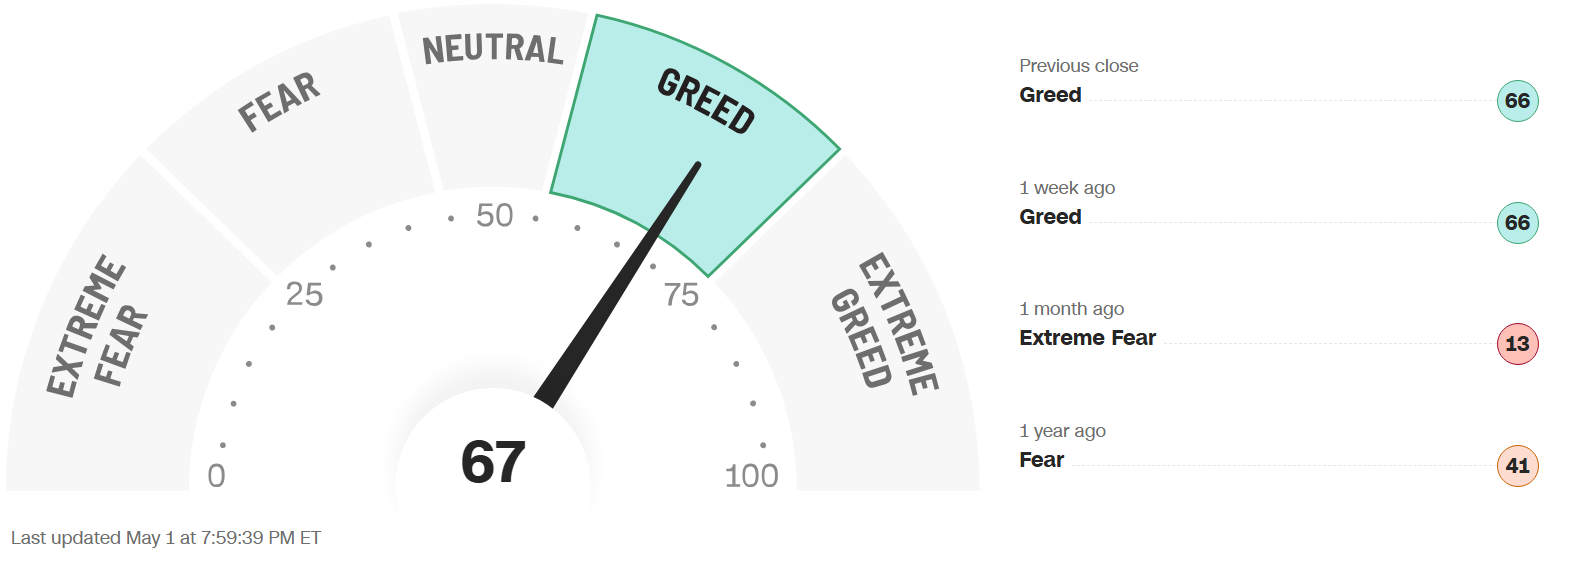
The Fear & Greed Index (found on cnn.com) is one of the easiest indicators to use to determine current market emotion. This simple to read gauge, highlighted in our publication When to Buy and When to Sell: Combining Easy Indicators, Charts, and Financial Astrology (available on Amazon), is measured in a range from 0-100, and currently reads 67 as of the close on Friday, May 1, 2026.
The gauge remained in the mid-Greed category all week, gaining 1 point from last week’s close of 66. This was also reflected in the S&P 500, which rose 65 points, from 7,165 to 7,230, mainly based on Thursday’s rally. The technology-heavy Nasdaq, after starting to slump mid-week, regained its momentum by gaining a whopping 622 points from its low early Thursday to the close on Friday, led by semiconductor stocks as the main catalyst. The quick recovery since the end of March has again exceeded all-time highs. On Friday, there was another bearish divergence, similar to last week, with the Dow Jones unable to hold Thursday’s gains, indicating caution in the short-term.
The 4 major indexes’ 200-day MAs (Moving Averages) internal sentiment remained in the bullish zone, with the number of stocks making new highs easily exceeding 50% on all indexes, including recent laggard Nasdaq 100, now at 56%. The shorter-term 20 and 50-day MAs were mixed as the landscape changed due to some sector rotation. The semiconductor sector ETF, ticker SMH, finally broke its historic 18 consecutive days of gains at the beginning of the week, but resumed its climb on Tuesday, and sits in clear overbought/extended territory in all time frames.
The “Risk-On” sentiment continued this week with the technology sector strength, and 10-yr bond yields rose slightly, ending the week at 4.37% vs last week’s close of 4.31%, as the Federal Reserve left rates unchanged, as expected. Stagflation concerns, when the economy is slowing and inflation is rising, remained tempered, with a positive start to earnings season.
The 7 internal factors used to formulate this gauge are listed on the screen (below):
Market Momentum – (S&P 500 vs its 125-day moving avg) = EXTREME GREED
Market Volatility (measured by the VIX) = NEUTRAL
Put to Call Ratio 5-day avg. (# of Puts (bearish) vs Calls (bullish) = FEAR
Stock Price Strength (# of new 52-week highs vs new 52-week lows) = GREED
Stock Price Breadth (# of shares rising vs falling on NYSE) = GREED
Safe-Haven Demand (which measures stocks vs bonds) = EXTREME GREED
Junk Bond Demand (non-govt. bond yield spread) = NEUTRAL
This week, only 1 of these 7 factors changed levels, as Stock Price Strength finally joined the momentum categories at the Greed level, reflected by the continued improvement in the index MAs. However, the all-important Put to Call Ratio remained at the Fear level, contributing to the divergent conditions mentioned earlier. This suggests a change in short-term sentiment in the futures options market, indicating a possible pullback after the major surge. As the number of stocks hitting 1-month highs cooled off considerably this week, the rally may not have much strength left in the near-term, and it at the very least vulnerable.
The VIX, measured by Market Volatility, decreased this week, closing 1.7 points lower at 17, vs last weeks close of 18.7. The gauge closed beneath the crucial “20” danger-zone level all week, where it has remained since April 8, reflecting the month-long recovery.
The geopolitical conflict in the Middle East, and energy prices, still remained in focus, though the market has assimilated the daily news to some extent. Though still vulnerable to verbal comments regarding the conflict, the reaction is not as strong as it has been recently. In addition, a report on Monday, stating that AI sales have been weaker than expected, caused an about face Tuesday morning, slowing the tech rally. Earnings from several of the MAG7 companies were also reported on Wednesday, with mixed results, as Google (Alphabet) and Amazon rose, while Meta and Microsoft slumped. Several chip companies were positive, however, again igniting the tech rally.
Economic data was steady this week, with no significant change in areas like Jobless Claims, GDP, Personal Expenditures, Housing, and Durable Goods orders, while Consumer Confidence and Manufacturing improved. The positives, of course, is the fast rebound from the recent pullback throughout the month of April. The negatives, however, include continuing layoffs, some housing issues, a looming private credit crisis (very risky), the fact that the S&P is only about 2% above the October highs (even after the massive recovery), and weaker broader market internals than it appears.
Astrologically, we transit through Taurus season (Apr 20 – May 20), energies have stabilized (as expected) from the Aries aggression of late March and early April. Taurus (the 2nd sign of the zodiac, ruled by Venus), is a money sign, whose attributes also include logical, down-to-earth, calm energies, with a positive financial theme. As we have mentioned, the 2nd half of April generally sees a calm down in the market volatility (VIX), which again has been the case.
Mercury, the planet of trading, will enter the sign of Taurus this weekend, lasting only two weeks until May 16, symbolizing continued strong financial reports, which have already begun with positive earnings from most banks and financial institutions. The planet recently formed a short-term conjunction with the planet Saturn (restriction), together with the Sun and Mars, signifying some restriction in the financial world, resulting in a pullback from over-extended conditions, which did occur on Monday and Tuesday in the S&P. Proceed with caution as the markets likely will continue to “even” out.
The planet Venus ended its short transit of Taurus last Friday, and entered Gemini with a conjunction with Uranus last weekend, on Saturday, April 25. Venus in Taurus was favorable for the Real Estate, Financial, and Consumer Discretionary sectors, as expected, which will likely cool off, and continues to signify positivity for Communications, Transportation/Airlines, and high technology, as it transits Gemini through May 18.
The planet Mars remains in the sign of Aries (its “ruling” sign with Scorpio), until May 17 (birth date of the U.S. Stock Market), symbolizing ultra-aggressive energies. Mars formed a square with the planet Uranus a few weeks ago, resulting in a sudden plunge in the technology sector. The conjunction between the Sun, Mercury, and Mars, with Saturn, on April 20, ignited more fireworks in that sector, as suggested last week. Mars’ overzealous energies can be dangerous in an uncertain market, so again, be sure not to FOMO into any speculative stocks for the time being, as market sentiment has become over-exuberant. As you can see, Mercury, Venus, and Mars (the shorter-term transiting planets) will all change signs within 2 days in a couple of weeks, which could be met with more short-term uncertainty and volatility.
We now, finally, have the much-anticipated permanent Uranus (sudden, unexpected events/high technology) entry into the sign of Gemini (ruled by Mercury - considered a lower-level Uranus), where it will remain until 2033. Gemini, like Uranus, represents high intelligence, communications, and technology, signifying major advances in those industries. Uranus’ sudden change energies were on full display again this week, with the reversal on Tuesday after that AI report. Do not be “surprised” if it continues, and please review our Trader Transits – Uranus in Gemini blog, dated 3-30-26, for more details.
Although the recent Saturn-Neptune conjunction (Feb 27), continues to separate, the effect is long-lasting with these slow-moving planets (explained the last several weeks). Both Saturn and Neptune will experience retrograde periods this summer, slowing the separation and extending their energies.
Leading sector Utilities continued to decline with the Risk-On sentiment, while recent leader Energy moderated, after dropping the prior 2 weeks, as oil’s roller-coaster ride continues with each news report regarding the military conflict. Recent laggards, including Consumer Discretionary, Financials, and Real Estate continued upward off historic lows from only a few weeks ago, as expected, which we have noted in this blog since March 29. Communicative Services has also increased, as we mentioned with the Mercury transit.
As we continued to stress, sectors of the technology industry that are likely to continue their advance into the future include AI, robotics, quantum computing, and space development, with both Pluto positioned in Aquarius, and Uranus in Gemini, for many years to come, though they will experience pullbacks along the way.
Gold (ruled by the Sun), and Silver (ruled by the Moon), fluctuated this week, though silver was stronger. The Gold to Silver Ratio (covered in our publication) finished the week at 61.2, a slight decline from last week’s close of 62.1, remaining rather neutral, but slightly favoring gold. Both metals remain good buys after pullbacks, so long as economic conditions remain the same, with central banks continuing to buy, and Safe-Haven investments expected to remain popular. Bitcoin (ruled by Uranus) has cooled off (no surprise), with Uranus’ leaving Taurus, though its ingress into Gemini (technology/transportation) accompanied by Venus (money) last week continues the positive sentiment that began with Venus in Taurus (money). Mercury’s entry into Taurus, as noted, resulted in some volatility. Its Fear & Greed Index now reads 46, remaining in Neutral territory, but lower after last week’s close of 60. Last month we suggested a possible bounce when the reading was 18, which proved to be an opportunity for profit.
***As always, this information is not intended to be financial advice, or any specific buy or sell recommendation, but rather a guide to assist the reader in some further understanding of current economic conditions/movements in the sky, and how they can affect moods, behaviors, world events, and financial markets.