FEAR & GREED INDEX 68
Weekly Update
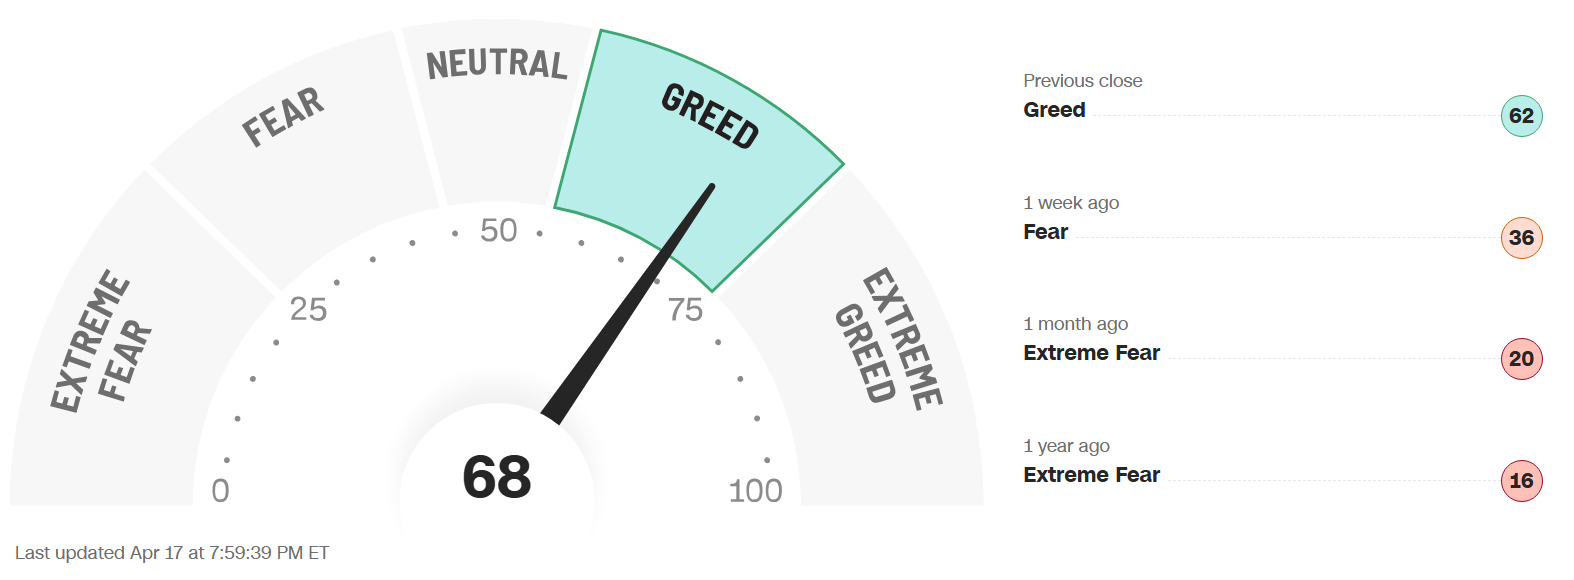
The Fear & Greed Index (found on cnn.com) is one of the easiest indicators to use to determine current market emotion. This simple to read gauge, highlighted in our publication When to Buy and When to Sell: Combining Easy Indicators, Charts, and Financial Astrology (available on Amazon), is measured in a range from 0-100, and currently reads 68 as of the close on Friday, April 17, 2026.
Suddenly, this reading has surged into the mid-Greed category, rising 30 points from last week’s close of 38. This was also reflected in the S&P 500, which gained a whopping 310 points, from 6,816 to 7,126. The technology-heavy Nasdaq has also seen gains for 13 consecutive days, as the MAGS are again leading the markets. It should also be noted that the market decline since the beginning of the Middle-East conflict has been fully recovered as of Tuesday morning.
The 4 major indexes’ 200-day MAs (Moving Averages) internal sentiment has also moved comfortably into the bullish zone, with the number of stocks making new highs easily exceeding 50% on all indexes. The shorter-term 20 and 50-day MAs surge this week dragged the 200’s with them, but are now flashing overbought/extended conditions.
The “Risk-On” sentiment continued in earnest this week, with the perception of the end of the Middle-East military conflict. 10-year bond yields fell, ending the week at 4.25%, vs last week’s close of 4.32%, though there was no change in sentiment that the interest rate policy will remain unchanged for the foreseeable future. Stagflation concerns, when the economy is slowing and inflation is rising, eased a bit with a positive start to earnings season.
The 7 internal factors used to formulate this gauge are listed on the screen (below):
Market Momentum – (S&P 500 vs its 125-day moving avg) = EXTREME GREED
Market Volatility (measured by the VIX) = NEUTRAL
Put to Call Ratio 5-day avg. (# of Puts (bearish) vs Calls (bullish) = EXTREME GREED
Stock Price Strength (# of new 52-week highs vs new 52-week lows) = FEAR
Stock Price Breadth (# of shares rising vs falling on NYSE) = GREED
Safe-Haven Demand (which measures stocks vs bonds) = EXTREME GREED
Junk Bond Demand (non-govt. bond yield spread) = NEUTRAL
This week, 4 of these 7 factors changed levels, as most market strength and momentum indicators flipped from Fear to Greed levels. Notice that Stock Price Strength, however, was not as strong, improving only from Extreme Fear to Fear. This indicates that the market strength is not as widespread as it might appear, and the larger weighted large-caps are boosting the market higher than all equal weighted stocks.
The VIX, measured by Market Volatility, declined further all week, closing down 1.7 points to 17.5, vs last weeks close of 19.2. The gauge dipped beneath the crucial “20” danger-zone level for the first time after 28 straight trading days last week, and moved steadily further under that measure, solidifying the current rally. Seasonally, the month of April tends to remain volatile in the early stages, but generally calms in the second half, which we have now entered. In 2025, the markets bottomed around April 8, due to tariff uncertainty, and current conditions imply these figures are dependent on the global conflict coming to an end.
The geopolitical conflict in the Middle East, and energy prices, remained in focus as the market, news driven over recent weeks, seems to have assimilated the global military tensions into prices. Economic data was mixed, which did not sway the market in any one direction. Existing Home Sales fell 3.6%, Manufacturing rose 1.5%, the inflation gauge Producer Price Index (PPI) rose 0.5%, but was lower than expected (1.1%), and Jobless Claims remained steady in the low 200k’s. Also, do not forget (as mentioned in the past several weeks in this blog), we are in the 2nd year of the Presidential Cycle, which has historically posted the worst returns of the 4-year cycle (please review our Did You Know – About the Mid-Term Election Year blog, dated 12-27-25).
Astrologically, today is the completion of Aries season (the 1st sign of the zodiac, ruled by Mars), which began on March 21. Aries’ fiery, aggressive, act-first/think-later energies, have been reflected with many strong starts to trading days that faded out by the close. These energies normally start to subside in the 2nd half of the month, with the onset of Taurus season (Apr 20 – May 20), but again may be dependent on the status of the military conflict.
Mercury, the planet of trading, is now transiting Aries (Apr 14 – May 2), where it was conjunct the planet Neptune on Thursday, April 16. Unclear communications and oil/water related issues were highlighted again under this aspect. Mercury will now conjunct Saturn tomorrow, April 20, signifying some restriction in those areas, already suggested by the new report of another partial closure of the oil passage waterways in the Middle East.
The planet Venus ends its short transit of Taurus on Friday, Apr 24, and will conjunct Uranus, as they both move into Gemini. Venus in Taurus was favorable for the Real Estate, Financial, and Consumer Discretionary sectors, as expected, and signifies positivity for Communications, Transportation/Airlines, and high technology, as it transits Gemini through May 18.
The planet Mars remains in the sign of Aries (its “ruling” sign with Scorpio), from April 9 – May 17 (birth date of the U.S. Stock Market), symbolizing ultra-aggressive energies. Mars formed a square with the planet Uranus a few weeks ago, resulting in a sudden plunge in the technology sector. A conjunction between the Sun, Mercury, and Mars, with Saturn, tomorrow, April 20, is sure to ignite more verbal, aggressive, fireworks in that sector. Mars’ overzealous energies can be dangerous in an uncertain market, so again, be sure not to FOMO into any speculative stocks for the time being, as conditions appear to be extended and over-exuberant.
As the planet Uranus (sudden events) approaches its final days in the sign of Taurus (money), until April 25th, wild price swings are expected to continue, especially in the technology (Uranus) sector. The planet returns to Gemini, ruled by Mercury (considered a lower-level Uranus) a sign of high intelligence, communications, and technology, this week, where it will remain until May of 2033. Please review our Trader Transits – Uranus in Gemini blog, dated 3-30-26, for more details.
Although the recent Saturn-Neptune conjunction (Feb 27), continues to separate, the effect is long-lasting with these slow-moving planets. This conjunction traditionally causes a push-and-pull action between structure and restriction (Saturn) and dreams and ideals (Neptune), which has held true with the market uncertainty through March and early April. With the Sun, Mercury, and Mars crossing over these planets during Aries season, the likelihood of rallies starting, and stopping, with no clear direction, remains. Both Saturn and Neptune will experience retrograde periods this summer, slowing the separation and extending these energies.
Leading sector Utilities remained steady this week, though recent leader Energy plunged for the 2nd straight week, based on oil’s decline on the perceived progress in ending the military conflict. Recent laggards, including Consumer-related, Financials, and Real Estate continued upward off historic lows from only a few weeks ago, as expected, as noted in this blog just a few weeks ago on March 29. The rally has been sharp, and is now suddenly due for a retrace from those levels, at least in the short term. As we continued to stress, sectors of the technology industry that are likely to continue their advance into the future include AI, robotics, quantum computing, and space development (with Pluto positioned in Aquarius, and Uranus in Gemini for many years to come – when it returns next weekend, April 25), though they will experience pullbacks along the way.
Gold (ruled by the Sun), and Silver (ruled by the Moon), surged on both Tuesday and Friday this week, as they resume their recovery from the recent swoon. The Gold to Silver Ratio (covered in our publication) finished the week at 59.8, after last week’s close of 62.5, remaining rather neutral, but slightly favoring gold. Both metals remain good buys after pullbacks, so long as economic conditions remain the same, with central banks continuing to buy, and Safe-Haven investments expected to remain popular. Bitcoin (ruled by Uranus) continues its upward trend, since its Feb 5 low, picking up the pace from its long consolidation. Uranus’ ingress into Gemini (technology/transportation) accompanied by Venus (money) this week continues the positive sentiment that began with Venus in Taurus (money). Its Fear & Greed Index now reads 63, moving from Neutral to Greed territory, after last week’s close of 49. A few weeks ago, we suggested a possible bounce when the reading was 18, which has steadily developed.
***As always, this information is not intended to be financial advice, or any specific buy or sell recommendation, but rather a guide to assist the reader in some further understanding of current economic conditions/movements in the sky, and how they can affect moods, behaviors, world events, and financial markets.