FINANCIAL FOCUS
The 100-Year Cycle
In this installation of Financial Focus, we will discuss the topic of the economic 100-Year Cycle in the United States.
As we often discuss, equities markets tend to move in cycles that repeat, or “rhyme” over time. Cycles occur in long, intermediate, and short term “waves,” with crests and troughs that can be measured with historical data. Some popular cycles include Real Estate, which often moves in a 16 to 17-year pattern, seasonal sector rotation, and planetary transits for those who follow Astrology.
Another is the approaching 100-Year Cycle, originally created by Ohio farmer Samuel Benner. Though markets will never move in a perfect 100-year pattern, this period tends to signify transformational shifts. Modern technology, productivity, and monetary policies are also important for any period in the financial arenas, including the stock market, however, this cycle refers back to the Great Stock Market Crash of 1929, which actually did not bottom until May of 1932, losing a total of approximately 85%.
Since the end of that crash, the market has trended up on the whole, with a few additional corrections and “crashes” along the way, none of which came close in comparison (percentage-wise) with 1929. For instance, the other famous “crashes”, include Black Monday in October of 1987, which produced a total drawdown of about half (42%), and lasted only a few months, the Financial/Housing crisis of 2008 (44%) which continued for a little over 1 year, and the pandemic plunge in March of 2020 (22%) which only lasted a few weeks.
Though so much has changed in this century, including important technology advances (internet, advanced travel, algorithmic trading, etc.), as well as protective measures to “halt” trading to avoid massive drops, cycles do tend to repeat, or rhyme, with amazing consistency. Whether these strategies turn out to be self-fulfilling prophecies (as a large number of traders anticipate the move and essentially trigger the price action), or the combination of seasonality, global economic conditions, and sector strength/weakness (which can be measured in various times of the year), certain patterns tend to repeat at a high percentage level. The “snowball” effect is also difficult to contain, especially to the downside, when panic/fear sets in.
Similarities between then and now include high government and personal debt, over-hyped financial markets, and a dangerously high use of leverage (margin/borrowing), which often accompanies a “crash.” If growth cannot keep up with inflation, these factors can easily crumble the market.
Differences between the two periods, for the time being at least, includes unemployment figures that are currently under control. However, emerging technology that could threaten jobs and livelihoods (AI) could change that situation, like industrial agriculture and manufacturing did 100 years ago. Another major difference today is the use of online trading, machine trading and algorithms, which cause markets to move much faster. There are also the preventative measures that have been put in place to prevent major crashes (at least all at once) including “halting” market action at certain negative “levels.”
Astrologically speaking, we often note how planetary transits can be compared to technical chart analysis, as the investor or trader is searching for repeated patterns to increase the probability of financial gain. Currently, however, in the summer of 2026, none of the outer planets (Saturn, Uranus, Neptune, and Pluto) are transiting the same signs as they were in 1929.
Areas of note do include the planet Jupiter, which recently completed a 96-year cycle in October of 2025. This planet also entered the sign of Leo on June 30 (remaining until July of 2027), just a few weeks prior to the South Node entering Leo in mid-August, symbolizing a low point in the U.S. Business cycle. This is discussed in previous blogs and in Chapter 4 of our publication When to Buy and When to Sell: Combining Easy Indicators, Charts, and Financial Astrology (available on Amazon). Additionally, Jupiter’s 100-year cycle with Saturn will be complete in November of 2029, when the two planets will be in “opposition” to each other, which is a challenging aspect. Finally, Jupiter will also transit both Virgo and Libra in the next couple of years, signifiers of narrow markets and volatility, as we work through the bottom of the business cycle.
Another interesting cycle (see the chart below) occurs in 16 to 20-year periods of “When to Make Money.” This indicates that within each major cycle, there is a “minor” cycle at the exact mid-way point, where another reversal tends to occur. That mid-way point is currently positioned in 2026, suggesting an opportune time to sell stocks.
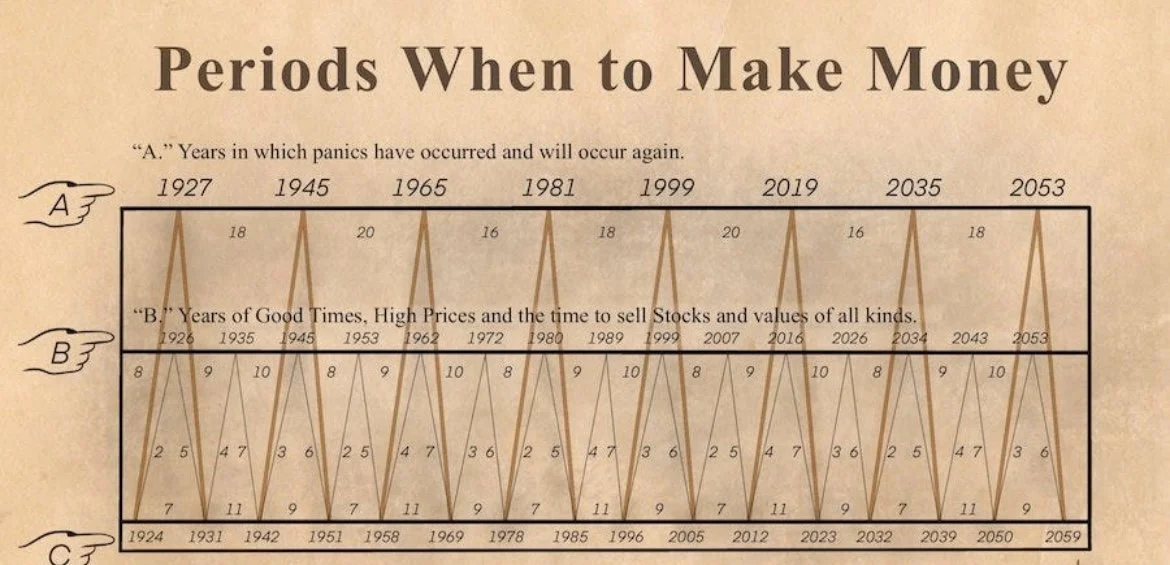
Overall, there are always factors that produce gains and losses in the equities markets, mostly due to human emotion and sentiment, as we often discuss. As always, one’s risk tolerance, age, and retirement plan need to be considered when deciding to invest, or trade. Stay disciplined, have a plan, and follow it! Review your options and consider consulting with a financial literacy expert by connecting with a professional on the website www.Becauseyourmoneymatters.com.
For additional discussions and education, please continue to visit our BLOG section here on ASTRO-FIN.com, where we provide periodic updates on a variety of topics.
***As always, this information is not intended to be financial advice, or any specific buy or sell recommendation, but rather a guide to assist the reader in some further understanding of current economic conditions/movements in the sky, and how they can affect moods, behaviors, world events, and financial markets.