CHART CHAT
Head & Shoulders
In this edition of Chart Chat, we will discuss another trading and investing strategy for new and/or inexperienced individuals. In Chapter 2 of our publication When to Buy and When to Sell; Combining Easy Indicators, Charts, and Financial Astrology (available on Amazon), we introduced common chart patterns that are regularly used for technical analysis.
For beginning investors, it normally takes a while to learn to read these patterns in their truest form. These patterns are not always obvious, and need to be combined with other factors, such as market sentiment, depth and length of the pattern, fundamentals, and indicators, to provide the highest probability of a successful trade.
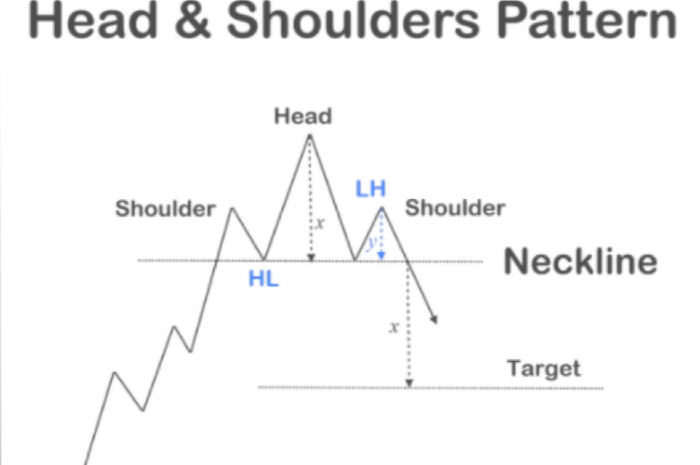
The focus in this blog is the bearish Head & Shoulders pattern, one of the easiest to identify as it develops on a stock chart, which is now appearing on several leading indexes. The basic premise of this pattern is a high price pivot (head), surrounded by a lower high (left shoulder) preceding the “head,” followed by a lower high (right shoulder) after the “head.” See the chart above…
What is most important is the price action following the formation of this pattern. The “neckline” is a focal point of the pattern, as it indicates the pullback level from the head and both shoulders. Though the “neckline” does not always need to be perfectly straight, it is often close, confirming a “support” line where there has been a significant amount of buying. The “inflection point” in this pattern occurs at the neckline of the right shoulder, as the following price action will determine if the expected drop in price will occur (bearish), or if the pattern “reverses” and turns back upward (bullish). Once the price “breaks” down through the “support,” and confirms (also discussed in our publication), the next price target down is likely to be reached. Should price “confirm” the “Exit Target” (depicted above), can be calculated by measuring the distance from the Head to the Neckline, then subtracting that same amount from the Neckline downward. More often than not that price “area” will be reached, even if not exact, giving the trader/investor an idea when the selling may stop.
For those who also “short” equities, or use PUT options, the same formula is true for an Inverse Head & Shoulders pattern, where the chart would flip upside down, indicating an expected bullish move in price under the same conditions.
Currently, as of the date of this blog, many of the major indexes, including the S&P 500, are sitting at the right shoulder/neckline intersection, awaiting the next move. Should price “break” the neckline, and confirm, there will be further to go to the downside, potentially turning the current pullback into a correction. A quick reversal (known as a “V” recovery - also discussed in our publication) would be beneficial and much better for market sentiment, in this traditionally strong market season.
The coming week will be a crucial point in determining whether this pattern will continue or reverse. Short-term traders should pay close attention to the daily charts, and keep share size low until the bullish or bearish direction is determined.
Whichever indicator or gauge meets your investment or trading strategy, those that show extreme conditions can be more reliable than those that do not. Remember to have a risk management plan, and learn your emotional boundaries.
***As always, this information is not intended to be financial advice, or any specific buy or sell recommendation, but rather a guide to assist the reader in some further understanding of current economic conditions/movements in the sky, and how they can affect moods, behaviors, world events, and financial markets.