CHART CHAT
In the Gap
In this edition of Chart Chat, we will discuss the Chart Pattern known as The Gap. As covered in Chapter 2 of our publication When to Buy and When to Sell; Combining Easy Indicators, Charts, and Financial Astrology (now available on Amazon), a “gap-up” or “gap-down” is very common in the price movement of an equity.
“Gaps” are defined by an opening price of an equity, on any time frame, which exceeds the previous bar or candle’s closing price. This creates a “space,” as the new opening price is not contained within the previous bar or candle, referred to as the “gap” (see chart above). Most “gaps” are caused by an earnings report, news item, or upgrade/downgrade. There are two scenarios that generally follow, usually creating favorable trading opportunities, at least for the short-term, depending on the immediate direction of price action after said “gap.”
Generally speaking, there are basically two types of “gaps” that need to be considered, the small gap and the large gap. Although there is no official distance from the previous close to the new opening price that distinguished the two, many traders consider anything over 2% to be a large gap. This is important to remember, as large gaps tend to continue in the direction of the “gap” (run), while small gaps tend to revert to the price prior to the “gap” (fill).
Gap Up
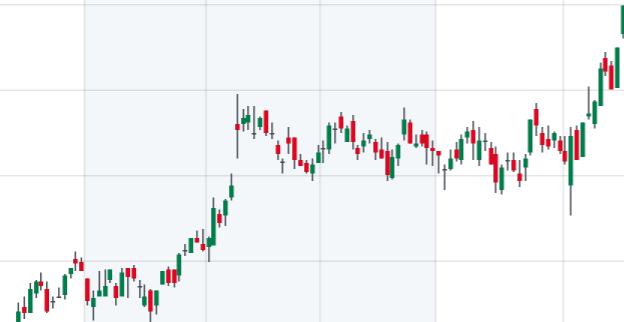
The figure above illustrates a “small” gap, in an uptrend, of less than 2%. It is clear to see that the “gap” was rather small, and returned to the pre-gap price (fill) within about 8 trading sessions.
Recognizing the immediate price action over the next few sessions of any “gap” assists the trader/investor in becoming more confident to act on the probabilities of a successful position/trade. The preceding trend, will either continue, consolidate, or reverse, based on several factors including volume, price strength, validity of data, and sentiment. The probable move, without any clear reversal signals, is for the trend to continue after this period. However, as we continuously repeat, it is the response and reaction (emotion) that usually drives the market action at any given time, especially short-term.
One of the main clues for trend continuation (run) is a large, high-volume bar on the session of the gap, with a close much higher than the open (for bullish trend), or a close much lower than the open (for bearish trend). The larger the candle, and the higher the volume, indicates that institutions are participating in the move.
For a reversal (fill), the price will generally fail to reach the high of the gap-up (or low in a gap-down) starting with the very next session, and will drift in the opposite direction until the pre-gap price is reached. This can happen very quickly, or slowly (like the figure above), but either way indicates a clear slowing of momentum from the “gap” day. The reversal suggests that more retail investors jumped on the catalyst (news/earnings/hype) that caused the “gap,” though it was unsustainable without institutional support.
The third result, consolidation, occurs when investors/traders become undecided, or price has reached current “fair value,” which prevents additional directional price action for the time being. This occurred in the chart above, for several weeks, before a “break” below support. In this instance another reversal took place, as price broke resistance without a “gap” in price. Ultimately another “gap” did occur, and the process started all over again.
In future editions of Chart Chat, we will continue to provide various technical pattern education, analysis, and potential price movement set-ups.
Astrologically speaking, planet positioning, and transits through the zodiac houses and signs, has many similarities to technical analysis. The theme of cycles, repeating patterns, and historical data can be viewed the same way, as the probabilities can be calculated for previous percentages of success. The difference is the use of an Ephemeris, a basic calendar of future planetary transits and aspects (see Chapter 4 of our publication for details), which allows for future positions to be known, unlike the next line, bar, or candle on a technical chart. Although no source will be 100% accurate, this extra layer can be very useful. For those interested, please refer to Trader Transits and U.S. Stock Market blogs on this site, as well as a portion of the weekly Fear & Greed Index update.
*** As always, this information is not intended to be financial advice, and should not be considered any specific buy or sell recommendation, but rather a guide to assist the reader in some further understanding of the financial markets.