FEAR & GREED INDEX 42
Weekly Update
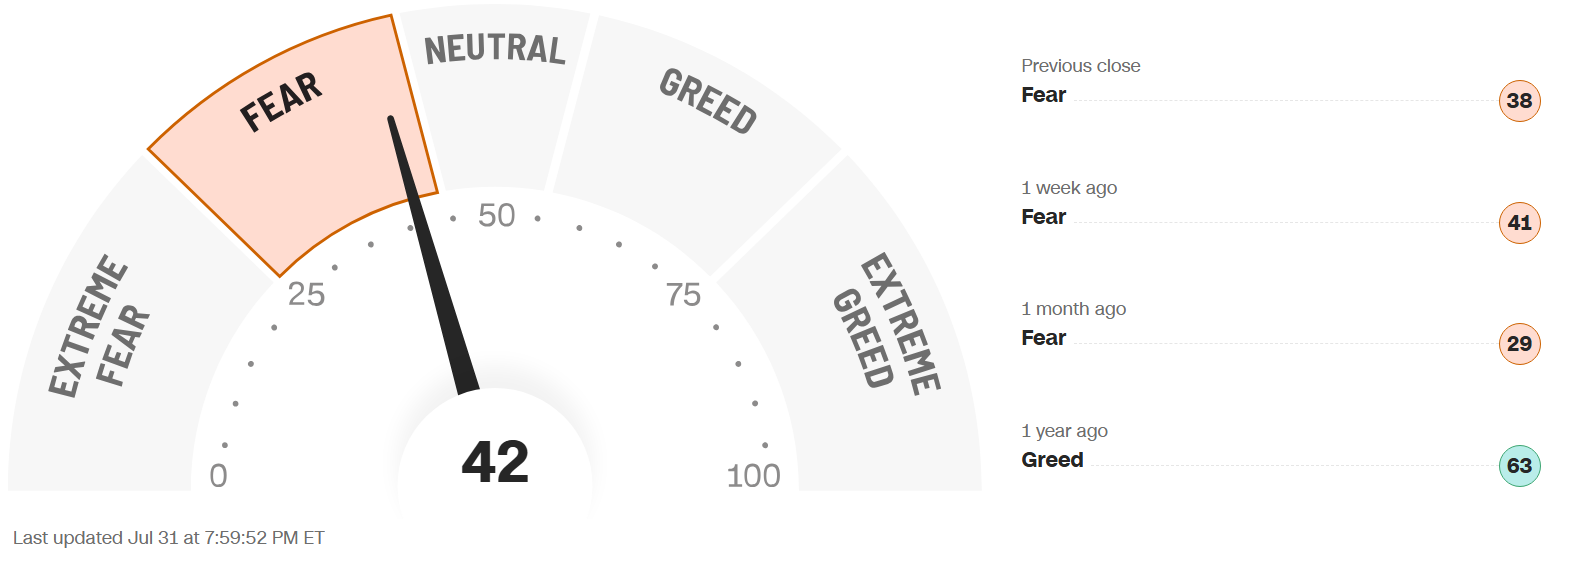
The Fear & Greed Index (found on cnn.com) is one of the easiest indicators to use to determine current market emotion. This simple to read gauge, highlighted in our publication When to Buy and When to Sell: Combining Easy Indicators, Charts, and Financial Astrology (available on Amazon), is measured in a range from 0-100, and currently reads 42 as of the close on Friday, July 31, 2026.
The gauge remained in the Fear category, inching up 3 points from last week’s close of 39. This was reflected in the S&P 500, which rose 77 points, from 7,412 to 7,489, after a surge on Thursday and Friday. The month of July ended on Friday, with a slight loss, uncharacteristic of this seasonally strong period, which we warned about in June.
The 7 internal factors used to formulate this gauge are listed on the screen (below):
Market Momentum – (S&P 500 vs its 125-day moving avg) = FEAR
Market Volatility (measured by the VIX) = NEUTRAL
Put to Call Ratio 5-day avg. (# of Puts (bearish) vs Calls (bullish) = FEAR
Stock Price Strength (# of new 52-week highs vs new 52-week lows) = FEAR
Stock Price Breadth (# of shares rising vs falling on NYSE) = EXTREME FEAR
Safe-Haven Demand (which measures stocks vs bonds) = NEUTRAL
Junk Bond Demand (non-govt. bond yield spread) = EXTREME GREED
This week, 2 of these 7 factors changed categories, as all momentum levels remained in the Fear category, as did the all-important, and wildly fluctuating Put to Call Ratio. The only change occurred in Safe-Haven Demand, which neutralized, and Junk Bond Demand, which moved to Extreme Greed with government bonds falling and yields rising.
Moving Averages’ (MAs) bullish sentiment remains steady, with the longer-term 200-days remaining around 56%, while shorter-term MAs rose slightly to 45% on the 20-MA (vs 42% last week) and dipped slightly to 51.6% on the 50-MA (vs 53% last week). The Nasdaq continued to in the bearish range, though it improved to the 46% range (vs last week’s 32 - 35%) on the 20-MA. Energy (with the military conflict re-ignited) and Financials (good earnings reports), which are always important for a bullish market, remained strong long-term, while Communications continued its weakness. Utilities and Real Estate declined in the short-term, especially the former, with the sector rotation.
The “Risk-On” sentiment fluctuated heavily this week with inflation, high interest rate, and AI overspending concerns, and the total reversal at the end of the week, as markets remained difficult to swing trade. The VIX, (market volatility), declined 2.8 points, to 16, by week’s end, vs last weeks close of 18.8. As we often note, any break-through of the crucial “20” mark suggests a pullback, which it did reach briefly on Wednesday, so keep an eye on this gauge. The recent intraday volatility continued as well, with frequent reversals. 10-yr bond yields rose 0.4 points to 4.72%, from last week’s close of 4.68%, as interest rates have reached 19-year highs. Earnings season is in full force, with mainly positive results, as expected with 2nd Quarter earnings projected at an average increase of 23%, which has certainly moved some stocks based on confirmation or disappointment (as noted the past few weeks).
Economic reports this week focused on weaker-than-expected GDP, strong jobs numbers, and the FOMC meeting that produced no change in the interest rate policy for the time being. It was interesting that 3 of the 12 Federal Reserve members disagreed (or dissented) with that choice, setting up a possible change in sentiment in the near future, or at the very least, uncertainty in the bond market.
Astrologically, we continue through Leo season (self, leadership), until August 22. Leo, a fixed, fire sign, is known for more weakness in market performance than its predecessor, Cancer, which is historically the 2nd strongest. Major uncertainty persists in current market conditions, which are not expected to change anytime soon. Please review our Sign Language – Leo blog, dated 7-8-26 for more details.
Current shorter-term transits/aspects of note include the planet Venus remaining in the sign of Virgo for a few more days (through Aug 6), symbolizing a more critical, meticulous, and selective (Virgo) market in the short-term. As is typical of Virgo, the “loved” stocks have flourished, while the “hated” have been punished, as we suggested. This has coincided with “earnings season,” which often distinguishes the strong and weak companies. Venus will next enter Libra, a more balanced energy sign. Mercury will also change signs next weekend, moving from Cancer to Leo, signifying major communications among global leaders, as it approaches a conjunction with the Sun. This could also move markets based on those positive or negative headlines.
Longer-term, the planet Jupiter has settled into the sign of Leo (entered June 30), where it will remain until July 26, 2027, highlighting fashion, self-pleasing products, and travel (signified by the Consumer Discretionary sector), as well as leadership, defense, and gold. Stocks in those sectors have shown some improvement (as expected), which could continue along with rising consumer sentiment, though Venus’ influence has now moved out of Leo. Please refer to our Trader Transits – Jupiter in Leo blog, dated 6-12-26, for further information. Keep in mind that travel-related stocks are also sensitive to oil prices, which are vulnerable to the military conflict status (or “perceived” status). Also, as discussed heavily in recent months, Uranus (sudden, unexpected events/high technology) will remain in the sign of Gemini (communications, transportation, advanced technology) until 2033. Uranus’ energies continue to be on full display of late, with quick, unexpected reversals, in both directions, as the market cannot seem to make up its mind (Gemini). As we’ve also mentioned in the past several weeks, do not be “surprised” if this type of market action continues with these other planetary transits. Please also review our Trader Transits – Uranus in Gemini blog, dated 3-30-26, for more details.
As we have noted for over 1 year now, sectors of the technology industry that are likely to continue their advance into the future include AI, robotics, quantum computing, and space development, with both Pluto positioned in Aquarius, and Uranus in Gemini for many years to come, though they will experience pullbacks (sometimes sizeable) along the way.
Gold (ruled by the Sun), and Silver (ruled by the Moon), finished slightly higher this week, though they have been consolidating for weeks. The Gold to Silver Ratio closed at 70.1, up only 0.5 points from last week’s close of 69.6, remaining rather neutral. As we continue to stress, both metals remain good buys after pullbacks, so long as central banks continue to buy, which they are, and Safe-Haven investments remain popular, which is expected.
Finally, Bitcoin (ruled by Uranus) has hopefully found a bottom. Its Fear & Greed Index closed at 36, vs last week’s close of 35, basically unchanged, as the asset continues to consolidate. The Clarity Act, a bill designed to regulate the cryptocurrency and blockchain spaces in the U.S., and could boost the sector, advanced through the committee on Friday, July 24, and now awaits Senate approval. Please see our Did You Know? – About The Clarity Act blog, dated 7-26-26, for further information.
***As always, this information is not intended to be financial advice, or any specific buy or sell recommendation, but rather a guide to assist the reader in some further understanding of current economic conditions/movements in the sky, and how they can affect moods, behaviors, world events, and financial markets.