CHART CHAT
Mean Reversion
In Chapters 2 and 3 of our publication When to Buy and When to Sell; Combining Easy Indicators, Charts, and Financial Astrology (available on Amazon), we introduced some basic chart patterns and indicators relating to “over-extended” equity prices. In this edition of Chart Chat, we will discuss the concept of “Mean Reversion,” a very useful concept for shorter-term traders.
Utilizing Moving Averages, trend lines, and indicators, as well as understanding price action, cycles, and money flow, are all valid sources to implement into any strategy. Understanding other pertinent layers to your research, however, can make a huge difference prior to the analyzation of a specific stock chart. If you are not an experienced day-trader or investor, it is very easy to get caught up in the news, and short-term price action, that may not necessarily reflect the true trend or direction.
Mean Reversion refers to normal price action following a large deviation (in either direction) regarding the normal range of a stock, equity, or index. This can be measured with a variety of indicators, including the Average True Range, Fibonacci retracement levels, Bands and Channels, and certain indicators, as well as The Fear & Greed Index and the VIX (covered in our weekly blogs), all of which are discussed in our publication.
The concept of mean reversion is very simple. When price movement of an equity moves too far, too fast, it is very likely to experience some type of “pullback,” before continuing, stalling, or even reversing their current trend. For intermediate and long-term investors, this reversion may be of no consequence or interest, so long as it is not an actual sustained reversal. For shorter-term swing or day traders, this concept is very important to their potential profit or loss.
When you identify, that a stock, sector, or index is over-extended, that is a sure sign that a mean reversion is not far away. This reversion, or retracement, does not necessarily indicate a “crash” or a “must sell” condition, but one should expect at least a temporary direction change.
The “pullback” can be interpreted as very healthy during a sustained uptrend as the asset may require “time to breathe” before resuming its climb. With pre-set levels for profit-taking often built into trading algorithms, too high a trajectory can trigger sell orders. This type of price action is the main reason why stocks never go straight up or down, evident by “waves” illustrated on a technical chart.
There are also additional, more advanced tools and indicators utilized mostly by day, and swing traders, such as the VWAP, the VOLD, (for trading the S&P 500), the Point of Control, and certain Relative Strength Indicators, that can identify excellent entry points based on mean reversion.
Figure 1 represents an example of Mean Reversion, with several optimal entry points along the way. As depicted, the purple line through the center of the chart represents the mean price through a specific period. This illustration uses the 50-day EMA (Exponential Moving Average - also explained in our publication), however, one can use any of the above noted indicators, on any time frame. The price action exemplifies the usual reversal in direction once the stock price reaches “extended” conditions (also referred to as “overbought” or “oversold”). In other words, the further away price strays from the mean, the more likely it is to return to, or close to, that point/price.
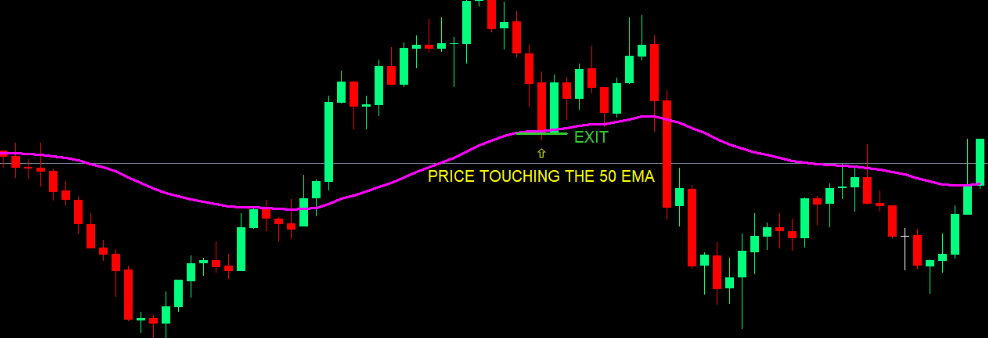
FIGURE 1
On this provided chart, there are 5 examples of price reverting to the mean. On each occasion, the equity price “extended” to a certain point above or below the standard (50-day EMA) before returning to that level. On 3 of those occasions, price crossed over the mean and continued the short-term trend (break-out), while on two other occasions the mean was a reversal pivot point. Remember it is important to use confirmation (also explained in our publication) on any break-out or reversal before entering or exiting a position.
Figure 2 illustrates a perfect example of a stock providing an opportunity to “channel” trade in an uptrend. By following the selected indicator (Keltner Channel, simple trend lines, etc.) clear parallel lines formed for Support (bottom line) and Resistance (top line) as a guide to price action. When this price action can be detected, positions can be entered at those levels, with confirmation, for high probability trades.
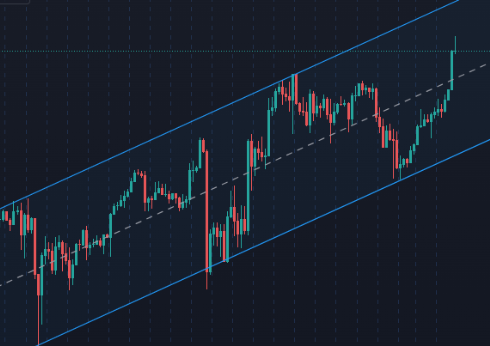
FIGURE 2
In this instance, the Resistance level was hit twice, and the Support 3 times, but overall remained within the channel. The mid-line (or mean) was also reached and/or crossed on several occasions, after “extended” conditions. It is suggested for new traders to understand and utilize basic mean reversion strategies, as they provide a higher rate of success for swing trades, which allow for more time to make decisions.
***As always, this information is not intended to be financial advice, or any specific buy or sell recommendation, but rather a guide to assist the reader in some further understanding of current economic conditions, chart analysis, or movements in the sky, and how they can affect moods, behaviors, world events, and financial markets.