FEAR & GREED INDEX 43
Weekly Update
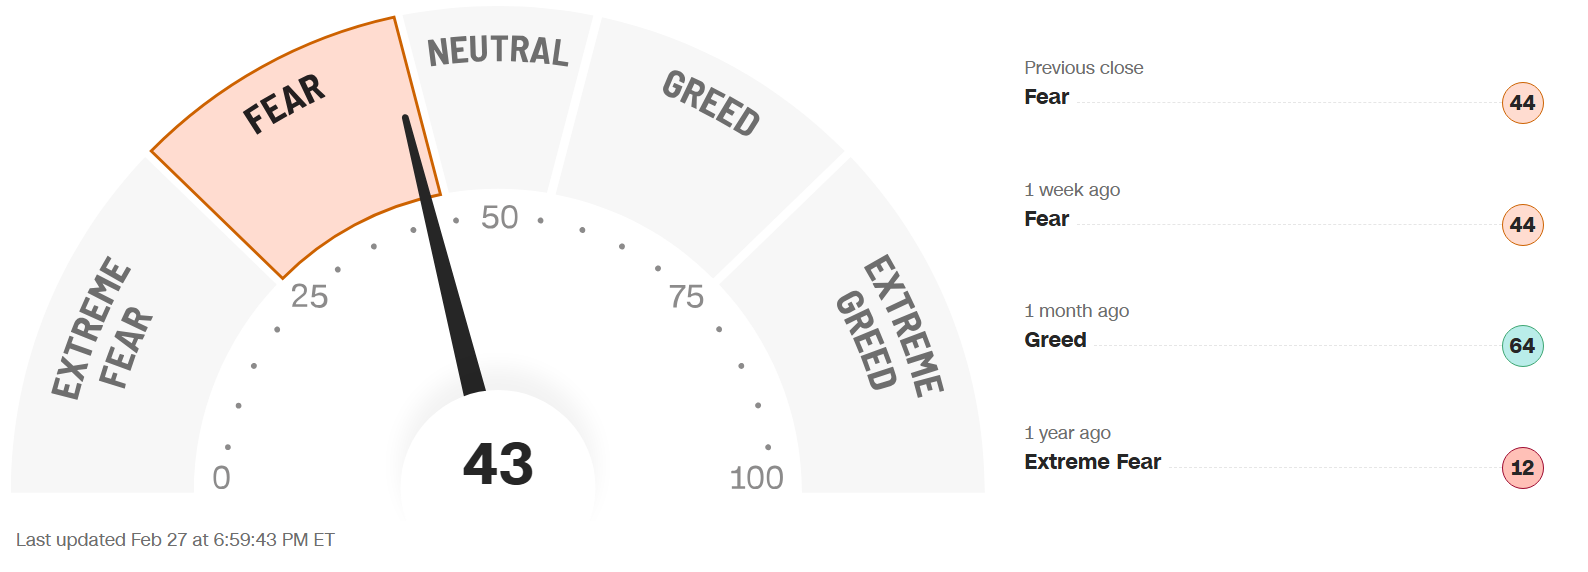
The Fear & Greed Index (found on cnn.com) is one of the easiest indicators to use to determine current market emotion. This simple to read gauge, highlighted in our publication When to Buy and When to Sell: Combining Easy Indicators, Charts, and Financial Astrology (available on Amazon), is measured in a range from 0-100, and currently reads 43 as of the close on Friday, February 27, 2026.
This figure bounced around slightly during the week but ended even, in the upper-Fear level, again closing at 43. This was reflected in the S&P 500, which dropped only about 31 points, from 6,909 to 6,878.
The 4 major indexes’ 200-day MA (Moving Average) internal bullish sentiment decreased as the week progressed, all dropping a few percentage points (with the DIA still leading at 70%), while each index’ shorter-term 20 and 50-day MAs are flirting with bear market territory around 50%. The S&P 500 remains the strongest, holding in the low 60% range.
The “Risk-Off” sentiment dominated this week, with continued “Flight to Quality” from stocks to bonds, and a selloff into weeks end. 10-year bond yields again fell (to 3-month lows), ending the week at 3.95%, vs last week’s close of 4.09%, the first close under 4% since November.
The 7 internal factors used to formulate this gauge are listed on the screen (below):
Market Momentum – (S&P 500 vs its 125-day moving avg) = EXTREME FEAR
Market Volatility (measured by the VIX) = NEUTRAL
Put to Call Ratio 5-day avg. (# of Puts (bearish) vs Calls (bullish) = EXTREME FEAR
Stock Price Strength (# of new 52-week highs vs new 52-week lows) = EXTREME GREED
Stock Price Breadth (# of shares rising vs falling on NYSE) = EXTREME GREED
Safe-Haven Demand (which measures stocks vs bonds) = EXTREME FEAR
Junk Bond Demand (non-govt. bond yield spread) = EXTREME FEAR
This week only 2 of these 7 factors changed levels, as Market Momentum slid deeper into the Fear category at the end of the week. The VIX, which again oscillated all week, barely returned to Neutral, from Fear, by the close on Friday. As discussed, the seasonal volatility has returned, and mixed signals continue to keep uncertainty and risk aversion at heightened levels. It should also be noted that although the Put to Call Ratio remained at the Extreme Fear level, suggesting the put buying may be getting overdone, which would indicate an upcoming improvement in equities.
As noted, and expected, the VIX, measured by Market Volatility, oscillated quite a bit again during this week, closing at 19.8, compared to last week’s close of 19.1. The crucial “20” level was crossed again on Monday, and hit that level a few times throughout the week, before settling just under that mark. As we have discussed the past few weeks, February is one of the seasonally weakest months of the year for equities over the past few decades, so this is no surprise.
As also discussed, the chip sector normally experiences strength around mid-month, and did just that prior to powerhouse Nvidia’s earnings report on Wednesday evening. Despite easily beating expectations, and providing a very positive forward outlook, the stock slumped on Thursday and Friday, a typical example of “Buy the rumor, Sell the news,” and should rebound again in the coming weeks.
News this week mainly focused on Nvidia (NVDA) earnings, but also the impending military conflict that escalated overnight on Friday. As a result, nervousness ruled the market at the end of the week, and Monday may see some spillover.
As we also discussed the past few weeks, we have now officially entered the 2nd year of the Presidential Cycle, known as the Mid-Term Year, which has historically posted the worst returns of the 4-year cycle, at least leading up to the elections. Please see our Did You Know – About the Mid-Term Election Year blog, dated 12-27-25, for more details.
Astrologically, Pisces season (Feb 19 – Mar 20), ruled by Jupiter, has begun, which is the 12th sign of the zodiac. Please see our recent Sign Language – Pisces blog, dated 2-6-26 for full details. The challenging Saturn energies of Capricorn and Aquarius have now been replaced by the energies of Jupiter (expansive) and co-ruler Neptune (imaginative, secretive), which again causes uncertainty in the equities markets.
The planet Mercury remains in the sign of Pisces (Feb 6 – Apr 14), an unusually long time for one sign, and began its current retrograde period on Thursday (Feb 26). Miscommunication, false reports, and uncertainty on a global basis are back in play, and the retrograde will extend these energies. Be cautious with new investments through this period, and keep in mind that the Communication Services sector will likely remain weak.
The planet Venus is also transiting the sign of Pisces (Feb 10 – Mar 6) for a while longer, symbolizing dreams and irrational exuberance. Don’t fall in love with an investment, and again beware false information and/or break-outs. This planet will next conjunct both Neptune on March 7 (bullish) and Saturn on March 8 (bearish), just as the planet enters Aries, so be ready for more potential fireworks on Monday the 9th as the Mars (ruler of Aries) aggression kicks in.
The planet Mars also enters Pisces tomorrow (Mar 2 – Apr 9) leaving behind the Aquarius challenging energies that had slowed Mars down (please see our Trader Transits - Mars square Saturn blog, dated 11-29-25). Mars formed a square with the planet Uranus at the end of this week, resulting in another sudden plunge in the technology sector on Thursday and Friday. Mars’ overzealous energies can be dangerous in an uncertain market, so be sure not to FOMO into any speculative stocks for the time being.
The planet Jupiter remains in retrograde in the sign of Cancer (until March 11), and as previously discussed, Jupiter has very powerful expansive energies, which have weakened a bit recently, but may ramp up again with the planet returning to prominence in March.
The planet Uranus remains in the sign of Taurus (money) until late April, after finally ending its 6-month retrograde on February 4. Right on cue, the equities markets experienced wild swings on Wednesday (the 4th), in both directions, indicative of the Uranus energies, which have continued throughout the month. This planet also formed a square aspect to the Sun on Tuesday (Feb 17), resulting in a very strong start, which then petered out by days end. As noted above, it then squared Mars on Friday, which again ended in a strong downturn in technology stocks. Uranus returns to Gemini on April 25, where it will remain until May of 2033.
Finally, the long-awaited Saturn-Neptune conjunction arrived last Friday, the same day the Supreme Court (Saturn) made their decision regarding tariffs (Neptune). This conjunction traditionally causes a pull and push between structure and restriction (Saturn) and dreams and ideals (Neptune), which results in uncertainty. What happens next remains to be seen, and caution should be heeded as markets gyrate with no clear direction.
Leading sectors, with over 50% of stocks trading over their 200-day MAs, continues to include Energy, Utilities, Basic Materials/Industrials, and Consumer Staples (safer, more defensive industries), while the laggards, Infotech and Communicative Services (which basically led all of 2025), remain low. Real Estate and Financials slumped, which is not a positive indication in the short term. Sectors of the technology industry that are likely to continue their advance into the future include AI, robotics, quantum computing, and space development (with Pluto positioned in Aquarius, and Uranus in Gemini for many years to come – when it returns in April), though they will experience pullbacks along the way.
Gold (ruled by the Sun), and Silver (ruled by the Moon), surged again this week with the nervousness in the equities markets. Gold has now fully recovered from the “mini” crash only one month ago, while silver has recovered about 50%. The Gold to Silver Ratio (covered in our publication) declined slightly, ending the week at 56.3, after last week’s close of 60.4. Silver has generally been outpacing gold, though has been slowly evening off, lessening the imbalance. Both remain good buys after pullbacks, so long as economic conditions remain the same, with central banks continuing to buy, and Safe-Haven investments expected to remain popular. Bitcoin (ruled by Uranus) continues to struggle though it could experience a sharp upswing, as Uranus has turned direct in Taurus (money), and its Fear & Greed Index remains in Extreme Fear territory, suggesting a possible bounce. Stay cautious until a clear uptrend has developed.
***As always, this information is not intended to be financial advice, or any specific buy or sell recommendation, but rather a guide to assist the reader in some further understanding of current economic conditions/movements in the sky, and how they can affect moods, behaviors, world events, and financial markets.