FEAR & GREED INDEX 45
Weekly Update
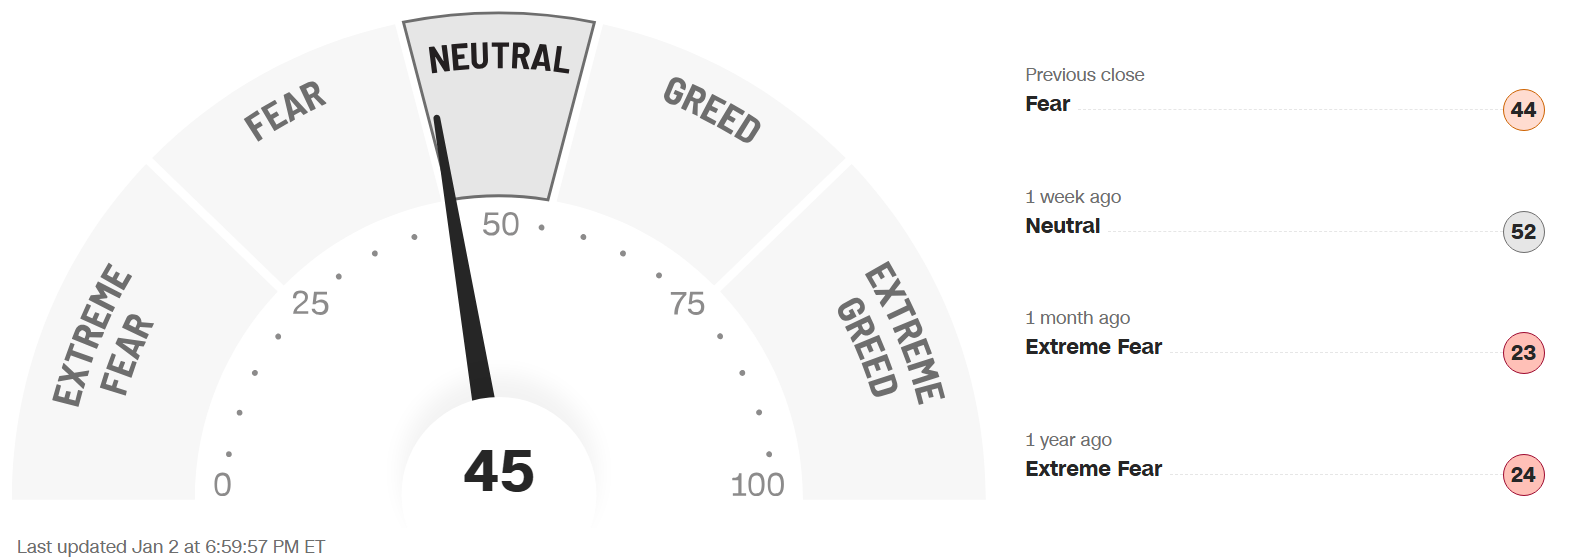
The Fear & Greed Index (found on cnn.com) is one of the easiest indicators to use to determine current market emotion. This simple to read gauge, highlighted in our publication When to Buy and When to Sell: Combining Easy Indicators, Charts, and Financial Astrology (available on Amazon), is measured in a range from 0-100, and currently reads 45 as of the close on Friday, January 2, 2025.
This figure moved just into the edge of the Greed level, after dropping 11 points from last week’s close of 56, as markets were basically muted during the 2nd consecutive holiday-shortened week. This was reflected in the S&P 500, as it fell about 71 points, from 6,929 to 6,858, in another low volume holiday-shortened week. The lower-than-average trading volume has prevented any conviction of bullish or bearish movements, which is expected to increase over the next week or two as holiday vacations end.
The 4 major indexes (S&P 500, Nasdaq, Dow Jones Industrial, and Russell 2000), internal bullish sentiment, regarding their 200-day moving averages, has begun to decline, as they are now in the 57-63 range. Each index’ shorter-term 20 and 50-day MAs have also declined, with the Nasdaq and IWM Small-Cap index taking the largest short-term hits. The seasonal strength of December (a month where fund managers alter their portfolios to buy leading stocks) has been mixed, with a short, and early, Santa Claus Rally, during the 5-day period from Thursday, December 18 through Wednesday, December 24, resulting in an increase of 3.1% on the S&P. Technically, this rally usually occurs during the last 5 trading days of the year, and first 2 of the new year (though it can shift with algorithmic trading and macro conditions), ending tomorrow, Monday, January 5, and averages a gain of 1.3%. The January Effect is now in play when “new” money traditionally is added to pensions and 401k’s, as well as underperforming stocks, such as small caps (IWM).
The “Risk-On” sentiment waned this week, as the Nasdaq dropped over 400 points, as a strong start on Friday, the first trading of the new year, also faded into the close. The financial and technology sectors, which usually lead bull runs, both suffered losses during the week. 10-year bond yields remained stubborn, closing the week at 4.19% vs last week’s close of 4.13%, suggesting the bond market is not quite convinced that the economy is in good shape. Keep in mind that the recent rate cut was “priced-in” to the market, and the Fed Chair’s comments regarding future cuts was not very convincing. Yields on long-term bonds are likely to stay elevated until that sentiment changes.
The 7 internal factors used to formulate this gauge are listed on the screen (below):
Market Momentum – (S&P 500 vs its 125-day moving avg) = FEAR
Market Volatility (measured by the VIX) = NEUTRAL
Put to Call Ratio 5-day avg. (# of Puts (bearish) vs Calls (bullish) = FEAR
Stock Price Strength (# of new 52-week highs vs new 52-week lows) = FEAR
Stock Price Breadth (# of shares rising vs falling on NYSE) = FEAR
Safe-Haven Demand (which measures stocks vs bonds) = EXTREME FEAR
Junk Bond Demand (non-govt. bond yield spread) = EXTREME GREED
This week 5 of these 7 factors changed levels, as the momentum categories all declined, though volatility remained very low. The Put to Call Ratio continues to reflect Fear sentiment, and spiked overnight on Thursday, suggesting a possible upward reversal on the horizon. Finally, Safe-Haven Demand, dipped after reaching Greed levels, and expected pullback from overbought conditions.
The VIX, measured by Market Volatility, rose by almost 1 point, closing the week at 14.5, vs. last week’s close of 13.6, as market volatility remains low. The crucial “20” level, has not been approached since November 24, and, as noted last week, the gauge is now at low levels where a reversal is probable. Look for a likely rise in the volatility in the new year.
News this week was light with the holiday, with no significant reaction to mixed housing and manufacturing reports. Mixed results over the past few weeks have resulted in neither a crash, or surge, in the equities markets thus far.
Additionally, we have now officially entered the 2nd year of the Presidential Cycle, known as the Mid-Term Year, which has historically posted the worst returns of the 4-year cycle, at least leading up to the elections. Please see our Did You Know – About the Mid-Term Election Year blog, dated 12-27-25 for more details.
Astrologically, Capricorn season (ruled by the planet Saturn) continues through January 19. Please see our recent Sign Language – Capricorn blog, dated 12-5-25 for full details. As the Sagittarius/Jupiter optimism and expansion of Sagittarius season (usually resulting in favorable market conditions), fades, they could be tempered by Saturn’s challenging energies.
The planet Mercury, entered the sign of Capricorn on Thursday, January 1 (through Jan 19), and is now weeks past its recent retrograde, which has resulted in lower volatility, as expected. The next Mercury Retrograde occurs from February 26 through March 22, which will likely coincide with the increased volatility we have discussed.
The planet Venus, is also transiting Capricorn (Dec 24 - Jan 16), after exuding holiday cheer during its stay in Sagittarius, symbolized by the increase in retail spending. However, it has been noted that only the top 10% of the income earners are responsible for 50% of the spending activity, and the Capricorn/Saturn influence has tempered that enthusiasm.
The planet Mars is also in the midst of a Capricorn transit (Dec 14 – Jan 22), theoretically reducing over-aggression, and rewarding hard work and persistence. As previously noted, Mars in Sagittarius symbolized aggressive gains in the short-term, however, the Saturn (ruler of Capricorn) energies have created a few challenges and slowed Mars down (please see our Trader Transits - Mars square Saturn blog, dated 11-29-25).
The planet Jupiter remains in retrograde in the sign of Cancer (until March 11). As previously discussed, Jupiter has very powerful expansive energies, which may weaken a bit for the time being.
Finally, the planet Uranus, which is currently in retrograde until February 4, remains in the sign of Taurus (money), and will not return to Gemini until April, 2026. This 6-month re-visit to the sign of money (ruled by Venus), could create more shocks to the markets, in either direction, so beware. Please review our Planet Power – Uranus Retrograde blog, dated 8-27-25 for further details. The January Effect, noted above, in our publication and previous blogs, could also result in a sudden reversal in small caps (the IWM index), as often occurs in this month.
Leading sectors, with over 50% of stocks trading over their 200-day MAs, include Financials (always needed for bullish markets) and Healthcare, while Energy has spiked. Real Estate and Consumer Staples continue to lag, as affordability is a big issue. The recent Utilities decline is mainly a result of the low VIX, as they are a safe play in more volatile market conditions. Sectors of the technology industry that are likely to continue their advance into the future include AI, robotics, quantum computing, and space development (with Pluto positioned in Aquarius, and Uranus in Gemini for many years to come – when it returns in April), but will experience pullbacks along the way.
Gold (ruled by the Sun), and Silver (ruled by the Moon), oscillated heavily this week, especially silver, with both ending the week down. The Gold to Silver Ratio (covered in our publication), rose slightly, closing at 59.4, compared to last week’s close of 57.2, remaining very low, suggesting gold may be a better “value” buy at the current time. Both remain good buys after pullbacks (which they were due for) in the current economic conditions, as central banks continue to buy, and Safe-Haven investments remain popular. Bitcoin (ruled by Uranus) consolidated this week, but remains skittish, as the Uranus retrograde is nearing its end.
***As always, this information is not intended to be financial advice, or any specific buy or sell recommendation, but rather a guide to assist the reader in some further understanding of current economic conditions/movements in the sky, and how they can affect moods, behaviors, world events, and financial markets.