CHART CHAT
Natural Trajectory
In this edition of Chart Chat, we will discuss the trend line known as Natural Trajectory. As covered in Chapter 2 of our publication When to Buy and When to Sell; Combining Easy Indicators, Charts, and Financial Astrology (available on Amazon), technical charts can assist in determining when an equity stock price has become “over-extended” in either direction, suggesting a coming “retracement” or “mean reversion.”
As we have discussed in the past, “over-extended” conditions occur when a stock price moves “too far, too fast” out of its normal trading range, usually in a short amount of time. Many metrics are used by investors and traders alike to determine when a pullback in price is expected or due.
Some of these indicators include…
· An extreme high or low reading on the Relative Strength indicator
· An extreme high or low reading on the Fear & Greed index
· Percentage moves above Support & Resistance and/or Moving Averages
· Keltner channels
· Bollinger bands
· And many more…
The Natural Trajectory of a trend is another, lesser known, source of analyzing extended conditions, as well as the “target” of a potential pullback, which allows a comparison of the current short-term price action to the underlying longer-term trend itself. Using the Natural Trajectory as a guideline to where “fair” price should likely fall at any given time, can often be more accurate than less established shorter-term price action.
The chart below signifies an example of Natural Trajectory compared to a short-term trend.
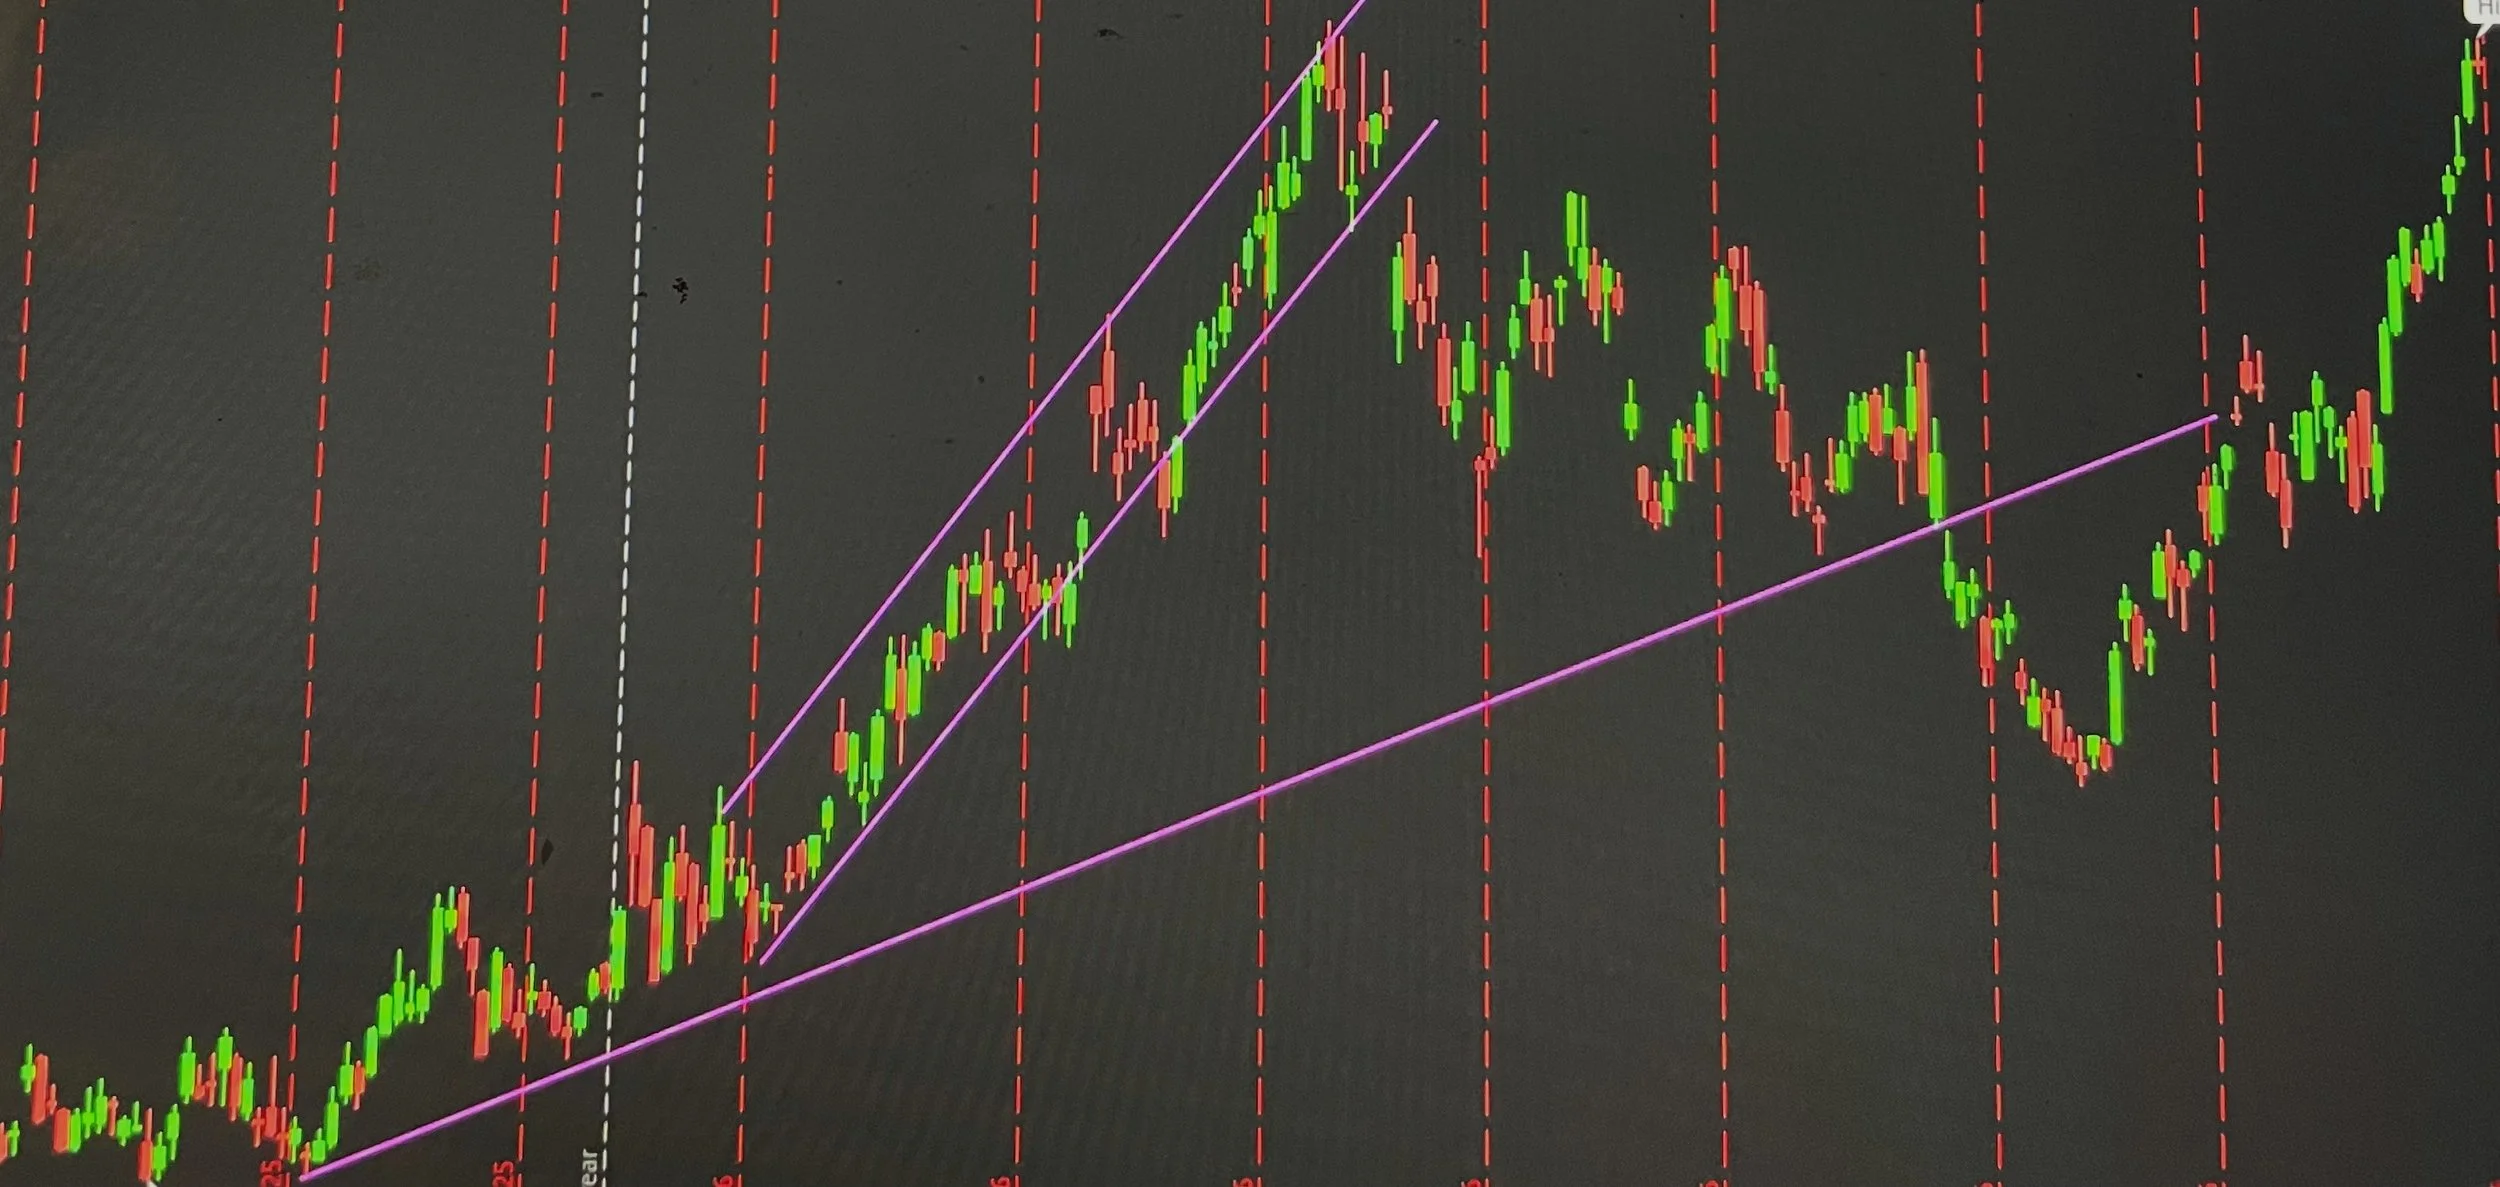
As depicted, a steady channeling uptrend of the stock was followed by a short-term spike. Traders who recognized the set-up prior to the spike would have profited, however only if they recognized the over-extended conditions and the signs of reversal near the top. The upward rising channel starting at the original break-out was very steep, making it more vulnerable to a larger decrease once the selling starts. The “true” or “natural” trajectory would have been determined by drawing a trend line from the bottom of the higher-lows of the steady trend, extending it past the spiking channel trend. That line will often display where the equity is likely to fall once a downtrend occurs. Once reaching that point, and potentially breaking it (as this stock price did) confirmation is then needed before another uptrend can be anticipated.
Curiously, in this particular example, the downtrend stretched all the way to the original breakout, even passing the Natural Trajectory trend line, taking some time to revert back to that line.
More often than not, extended conditions will revert at least back to the bottom of a channel, support line, or even the Natural Trajectory. The Law of Averages plays a large roll in price action as well, due to “profit or loss taking,” “supply and demand,” and money rotation. Knowing this trajectory is very beneficial, especially for longer-term/swing traders who do not wish to just buy-and-hold all their stock positions, to benefit from extreme price moves in either direction.
Astrologically speaking, planet positioning, and transits through the zodiac houses and signs, has many similarities to technical analysis. The theme of cycles, repeating patterns, and historical data can be viewed the same way, as the probabilities can be calculated for previous percentages of success. The difference is the use of an Ephemeris, a basic calendar of future planetary transits and aspects (see Chapter 4 of our publication for details), which allows for future positions to be known, unlike the next line, bar, or candle on a technical chart. Although no source will be 100% accurate, this extra layer can be very useful. For those interested, please refer to Trader Transits and U.S. Stock Market blogs on this site, as well as a portion of the weekly Fear & Greed Index update.
*** As always, this information is not intended to be financial advice, and should not be considered any specific buy or sell recommendation, but rather a guide to assist the reader in some further understanding of the financial markets.