CHART CHAT
Pullbacks vs Reversals
In Chapter 2 of our publication When to Buy and When to Sell; Combining Easy Indicators, Charts, and Financial Astrology (available on Amazon), we introduced some basic chart patterns and how to interpret them. In this edition of Chart Chat, we will discuss trend disruptors referred to as “Pullbacks” and “Reversals.”
Utilizing Moving Averages, trend lines, and indicators, as well as understanding price action, cycles, and money flow are all valid sources to implement into any strategy. Adding another layer to your research, however, that reveals the underlying conditions of the overall market, or industry, can make a huge difference prior to the analyzation of a specific stock chart. If you are not an experienced day-trader or investor, it is very easy to get caught up in the news, and short-term price action, that may not necessarily reflect the true trend or direction.
At times, when visually analyzing a chart, it is not very difficult to determine the overall trend, on the surface, for a desired time frame. Long-term investors often remain in investments, or extended trades, so long as the trend remains intact. Shorter-term traders, however, usually choose to take advantage of various stages throughout the trend.
The Pullback and the Reversal are two patterns that provide various trading or investment opportunities, if they can be accurately detected.
Pullbacks are normally triggered by short-term profit-taking (at cycle highs in an uptrend), loss-taking (at cycle lows in a downtrend), short coverings, algorithmic trading programs, news items, and earnings reports. Shorter-term indicators like Bollinger Bands, Keltner Channels, Average True Range, Support & Resistance, VOLD, and the VWAP (among others) are also regularly used by day and swing traders for identifying ideal entry and exit points.
Reversals are often preceded by longer patterns including Head & Shoulders, Double/Triple Bottoms, Doji’s, major MA Crossovers, and/or indicators such as the Fear & Greed Index (see our weekly blog) and the Anchored VWAP.
There are patterns and indicators that are useful for both short and long term, including Bull and Bear Flags, Ascending/Descending Triangles, Fibonacci levels, Relative Strength (RSI), Point of Control, Accumulation/Distribution, Advance/Decline Line, Average Directional Index (ADI), and the VIX. Many of these are patterns and indicators are covered in our publication for review.
As noted, pullbacks are healthy pauses in a strong trend (in either direction), that allows for the average price to moderate from extended price conditions, as many of the patterns and indicators mentioned above will illustrate. Generally speaking, the faster the price move, and thus the sharper the slope, the more vulnerable it becomes to a change in direction. The pullback is usually slower to develop, lasts a shorter time, and loses less value. They may only result in a consolidation, before price resumes the trend, allowing the MA’s (moving averages) to catch up to price and extinguish the extended price conditions. This can also be referred to as “price discovery,” which is essentially a popular price to develop a new support level (in an uptrend), or resistance level (in a downtrend). A true pullback creates a new entry point for a high probability trade (see Figure 1a).
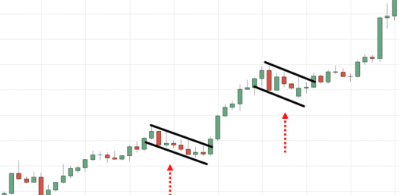
Figure 1a
Figure 1a depicts the perfect pullback situation in a clear uptrend, during a “step-ladder” pattern (discussed in our Chart Chat – Steppin’ Up blog, dated 1-8-25). The retracements occur on two occasions, are shallow, and last for only a short time. The candles generally become smaller (lower price range) near the end of the pullback, before a strong upward green (bullish) candle sparks the continuation of the original trend.
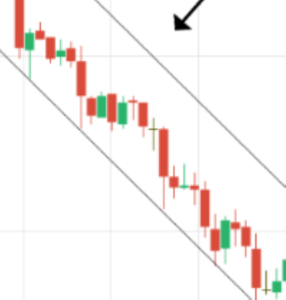
Figure 1b
Figure 1b demonstrates the same basic pattern in a downward trend, with 3-4 short pullbacks prior to trend continuation, triggered by a strong red (bearish) candle to the downside.
Reversals, on the other hand, are often quicker to develop, more violent in price action, and a bit tougher to identify. There are two types of reversals (U and V-shaped), with the main difference being the time it takes to develop. After a major selloff, they are also referred to as U or V-shaped recoveries, though they work the same in either direction.
The U-shaped reversal or recovery is easier to identify. This type will generally fall (or rise) from a pivot point (where direction changes), and move downward. After a large drop, when the selling stops, the U-shape will develop with a price consolidation along the bottom of the chart, before gradually moving upward again. This allows time for the trader/investor to assess the situation and make a more informed decision. Did the fall occur due to a bed earnings report, a disrupted deal or negative trial (in the case of a biotech stock), or was it dragged down by an out-of-favor industry? Contrarian investors will often take advantage when the stock begins an upturn, so long as the negative catalyst has disappeared, and/or the value of the company is now attractive. When a position is opened, the slower price movement also allows for time to determine if the trade was a wise decision. Figure 2a displays a typical U-shaped recovery.
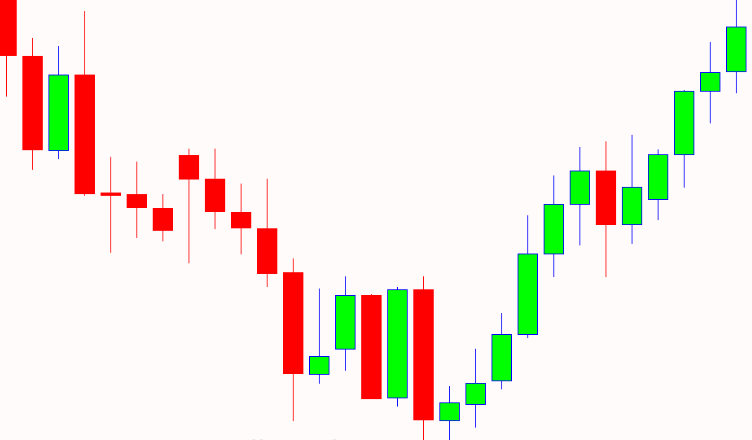
Figure 2a
As displayed, the typical U-shaped reversal, will occur following several red (selling) candles, with a bottom forming over a period of several sessions. The direction change will normally consist of small candles (tight range), before the reversal gains steam, consisting of mostly green candles, which increase in size. The same is true for the “inverse” U-shape, where a rally slowly turns to a turnaround in price.
On the other hand, the V-shaped reversal or recovery occurs very quickly, making it more difficult to detect at the instance it is taking place. The steep slope in either direction leading to a pivot point (cycle top or bottom) will quickly reverse and move in the opposite direction. The trick is determining, as fast as possible, whether the sudden change of direction is only a pullback, or an actual reversal. On many occasions the initial price direction change will result in a flag pattern (also discussed in our publication), which ultimately resumes the trend and does not result in a reversal. Watch for high volume and conviction (large candles) to assist in identifying the true V-reversal. Additionally, it also common for price to revert to close to the same point that the surge or plunge began. Figure 2b displays both a bullish and bearish V-shaped reversal of an equity.
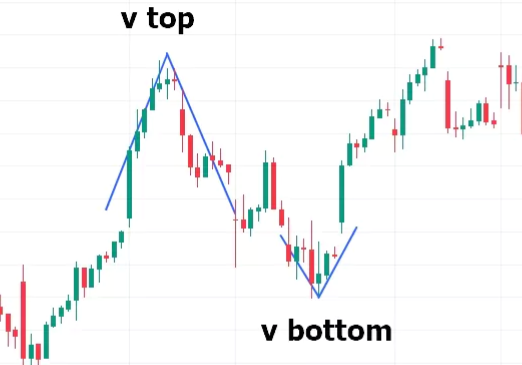
Figure 2b
As depicted, the initial large run-up on the left of the chart came to an end with a short consolidation (also indicative of a V-move), with topping wicks, which were then followed by large red candles. When the initial selling stopped, there was no real bounce, and priced rolled over again. Ultimately the selling came to an end with another large red candle, almost covering the entire length of the upward cycle, before another V-reversal to the upside. The same then happened in reverse, with larger green candles along the rally. Once again, the length of this move reached the same pivot point as the previous rally, before running out of steam.
Experienced traders will enter positions just as the pullback begins to show signs of changing direction, utilizing additional indicators, but will be attentive to “false” moves. For the beginner, or intermediate, it is best to start slow with small share sizes, wait for confirmation of the price move, and use good risk management. Building your way to improved confidence, emotional control, and recognition, will result in a higher probability of success.
In future editions of Chart Chat, we will continue to provide various technical pattern education, analysis, and potential price movement set-ups.
For those interested in Astrological analysis, planet positioning and transits through the zodiac houses and signs have many similarities to technical analysis. The theme of cycles, repeating patterns, and historical data can be viewed the same way, as the probabilities can be calculated for previous percentages of success. The difference is the use of an Ephemeris, a basic calendar of future planetary transits and aspects, which allows for future positions to be known, unlike the next line, bar, or candle on a technical chart (Please see Chapter 4 of our publication for more details). Although no source will be 100% accurate, this extra layer can be very useful. For those interested, please refer to our weekly Fear & Greed Index, and Trader Transits blogs, updated regularly on this site.
***As always, this information is not intended to be financial advice, or any specific buy or sell recommendation, but rather a guide to assist the reader in some further understanding of current economic conditions/movements in the sky, and how they can affect moods, behaviors, world events, and financial markets.